Cause and Effect Diagrams: Problem Solving Tool
advertisement
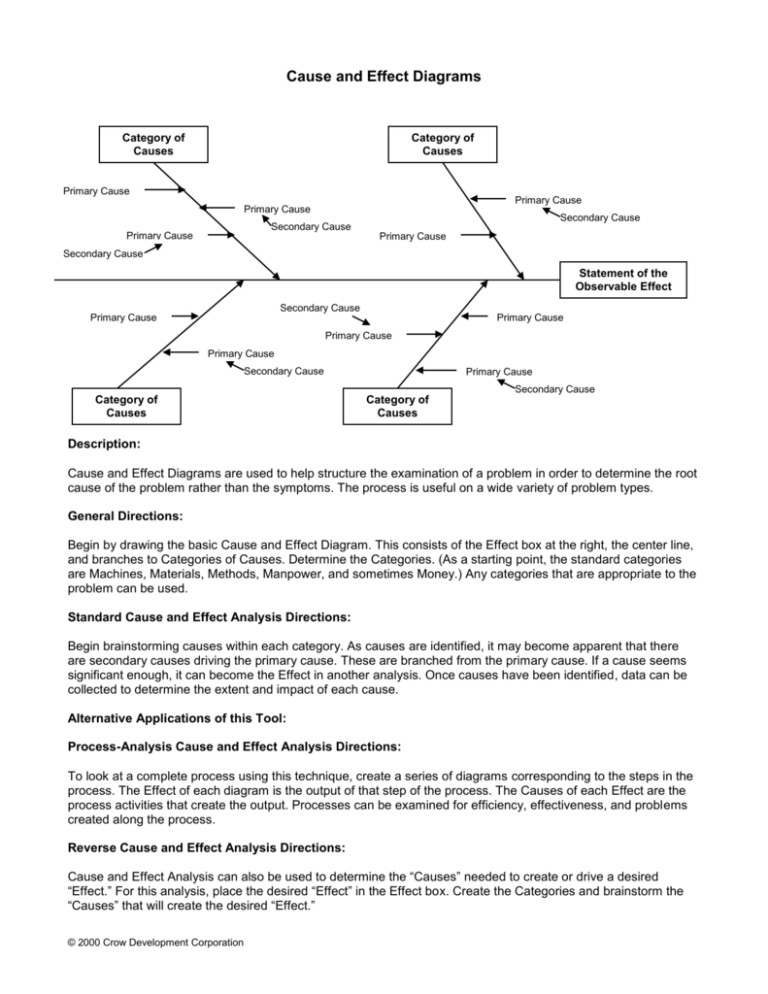
Cause and Effect Diagrams Category of Causes Category of Causes Primary Cause Primary Cause Primary Cause Secondary Cause Primary Cause Secondary Cause Primary Cause Secondary Cause Statement of the Observable Effect Secondary Cause Primary Cause Primary Cause Primary Cause Primary Cause Secondary Cause Primary Cause Secondary Cause Category of Causes Category of Causes Description: Cause and Effect Diagrams are used to help structure the examination of a problem in order to determine the root cause of the problem rather than the symptoms. The process is useful on a wide variety of problem types. General Directions: Begin by drawing the basic Cause and Effect Diagram. This consists of the Effect box at the right, the center line, and branches to Categories of Causes. Determine the Categories. (As a starting point, the standard categories are Machines, Materials, Methods, Manpower, and sometimes Money.) Any categories that are appropriate to the problem can be used. Standard Cause and Effect Analysis Directions: Begin brainstorming causes within each category. As causes are identified, it may become apparent that there are secondary causes driving the primary cause. These are branched from the primary cause. If a cause seems significant enough, it can become the Effect in another analysis. Once causes have been identified, data can be collected to determine the extent and impact of each cause. Alternative Applications of this Tool: Process-Analysis Cause and Effect Analysis Directions: To look at a complete process using this technique, create a series of diagrams corresponding to the steps in the process. The Effect of each diagram is the output of that step of the process. The Causes of each Effect are the process activities that create the output. Processes can be examined for efficiency, effectiveness, and problems created along the process. Reverse Cause and Effect Analysis Directions: Cause and Effect Analysis can also be used to determine the “Causes” needed to create or drive a desired “Effect.” For this analysis, place the desired “Effect” in the Effect box. Create the Categories and brainstorm the “Causes” that will create the desired “Effect.” © 2000 Crow Development Corporation
