Document
advertisement

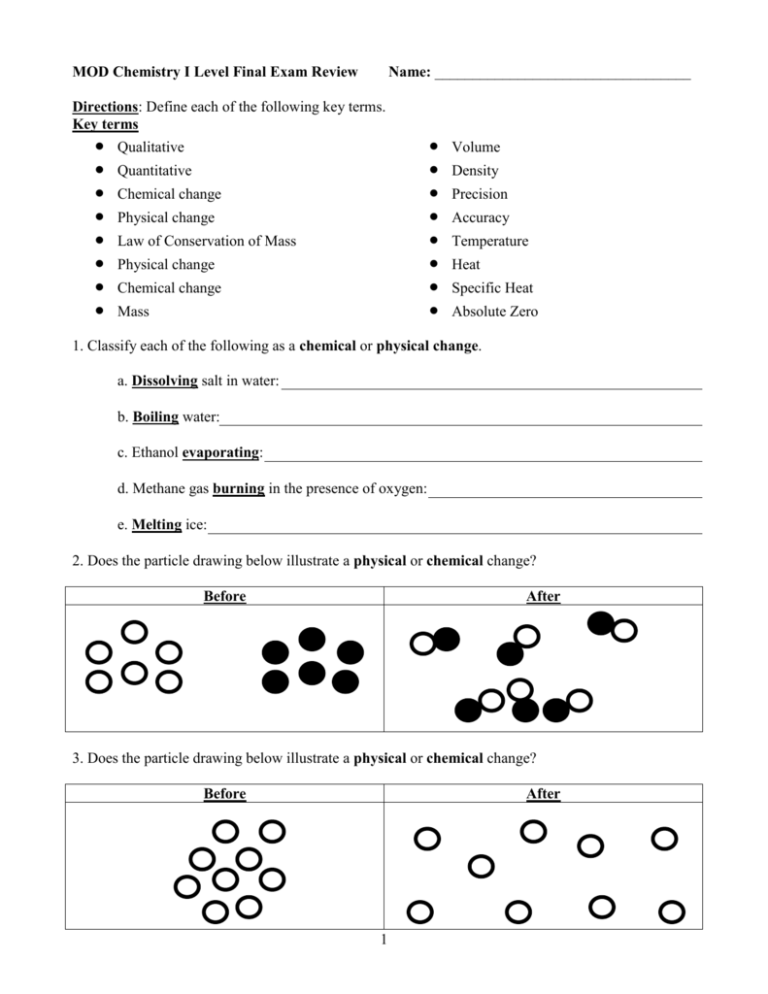
MOD Chemistry I Level Final Exam Review Name: __________________________________ Directions: Define each of the following key terms. Key terms Qualitative Quantitative Chemical change Physical change Law of Conservation of Mass Physical change Chemical change Mass Volume Density Precision Accuracy Temperature Heat Specific Heat Absolute Zero 1. Classify each of the following as a chemical or physical change. a. Dissolving salt in water: b. Boiling water: c. Ethanol evaporating: d. Methane gas burning in the presence of oxygen: e. Melting ice: 2. Does the particle drawing below illustrate a physical or chemical change? Before After 3. Does the particle drawing below illustrate a physical or chemical change? Before After 1 4. TRUE or FALSE: During chemical and physical changes, mass always changes. Directions: Given this graph, answer questions #5- 9. Length in centimeters vs Length in inches 12 y = 2.54x Length (cm) 10 8 6 4 2 0 0 0.5 1 1.5 2 2.5 3 3.5 4 4.5 Length (in) 5. Which variable is the independent variable? 6. Which variable is the dependent variable? 7. What should the value of the y-intercept be? Why should it be that value? 8. Write the mathematical model/equation (y = mx +b) that describes your graph. Be sure to: Substitute variable names for x and y. Abbreviate variable names. Include a value for slope. Include units for slope. 9. Write a “For Every” statement to relate the two variables of this graph in a scientific sentence. 2 Directions: Given this graph of mass vs volume data, answer questions #10-14. Substance A Substance B From the graph, estimate: 10. The mass of 4 mL of substance A: 11. The volume of 10 g of substance B: 12. Calculate the density of substance A and substance B. Show all your work and include appropriate units. 13. Draw particle pictures comparing the volume of Solid A and Solid B when their mass is 40 g. Substance A Substance B 14. Determine whether substance A and B will sink or float when placed in a bucket of water. A: sink float B: sink float (circle correct response) 3 15. Suppose you have two materials with different densities. In the boxes below, draw a diagram of how matter might be packed differently in each material. Less Dense Material More Dense Material 16. Suppose you have two materials with the same density. In the boxes below, draw a diagram of how matter might be packed in each material. Same Density Same Density 17. Suppose you have two materials with different densities. In the boxes below, draw a diagram of how matter might be packed differently in each material. Less Density More Density Directions: Predict the effect of changing P, V or T on any of the other variables. 18. When pressure increases, volume ________________ 19. When pressure increases, temperature __________________. 20. When volume increases, temperature __________________. 21. When temperature increases, pressure__________________. 4 Directions: Use the graphs below to answer questions #22-24: 22. Which graph above describes the relationship between pressure and volume? 23. Which graph above represents the relationship between pressure and absolute temperature? 24. Which graph above represents the relationship between the volume of a gas and the Celsius temperature? 25. Draw particle pictures to represent the relationship between volume and pressure. When the volume is 10 mL, the pressure is 200 kPa. When the volume decreases to 5 mL, the pressure increases to 400 kPa. Assume constant n and T. Before After 26. Draw particle pictures to represent the relationship between volume and temperature. When the volume is 12 mL the temperature is 180 K. When the volume increased to 20 mL, the temperature increased to 300 K. Assume constant P and n. Before After 27. Draw particle pictures to represent the relationship between pressure and temperature. When the temperature is 300 K, the pressure is 6 atm. When the temperature is increased to 400 K, the pressure increases to 8 atm. Assume constant V and n. Before After 5 Directions: Complete the following tables. Show work to justify your answers and include correct units to receive full credit. 28. A container of carbon dioxide has a volume of 375 cm3 and a pressure of 18 psi. If the container is crushed down to a volume of 125 cm3, what is the new pressure? Include particle pictures before and after. Before: P T V After n Initial Final Effect 29. The tire pressure is 30 psi when the car is in the driveway at 27 oC. Due to the friction between a tire and the road surface, the temperature of the air inside a tire increases as one drives. What is the pressure when the temperature of the air inside the tire increases to 57 oC? Include particle pictures before and after. Before: P T V After n Initial Final Effect 30. A gas in a sealed container exerts a pressure of 6.0 atm at 127oC. What is the new pressure when the temperature inside the containers reaches 27oC? Include particle pictures before and after. Before: P T V n Initial Final Effect 6 After Directions: Ethanol, a clear, colorless liquid, is used as an alcohol fuel (often mixed with gasoline) and in a wide variety of industrial processes. Ethanol is also used in antifreeze products for its low freezing point. D 31. According to this graph, when is ethanol a solid? a) A b) B c) C d) D 32. According to this graph, when is ethanol a liquid? a) A b) B c) C d) D 33. According to this graph, in what region is ethanol changing from a liquid to a gas? a) A b) B c) C d) D 34. According to this graph, what is the boiling point for ethanol? a) -115 °C b) 75 °C c) 100 °C 35. According to this graph, at what time would ethanol be completely a liquid? a) 50 seconds b) 100 seconds c) 200 seconds Directions: A sample of water is heated from a liquid at 40oC to a gas at 110oC. Exam the following heat curve and answer the questions below. 7 36. For section QR of the graph, state what is happening to the water particles as heat is added. 37. For section RS of the graph, state what is happening to the water particles as heat is added. Directions: Use the following choices for questions #38-42. A. increasing B. decreasing C. the same D. zero 38. During region B the thermal energy (ETH) is ______. 39. During region C the thermal energy (ETH) is ______. 40. During region A the phase energy (EPH) is ______. 41. During region C of the graph, the energy being absorbed is: a. increasing the speed of the water particles b. increasing the distance between the water particles c. decreasing the speed of the water particles 42. During region B of the graph, the energy being absorbed is: a. increasing the speed of the water particles b. increasing the distance between the water particles c. decreasing the speed of the water particles 43. Use an energy bar chart to represent the ways energy is stored and transferred as a cup of hot chocolate cools while sitting on the counter. Identify and circle the correct region on the cooling curve and include initial and final particle pictures. 8 Particle Picture Particle Picture (Initial) (Final) 44. Use an energy bar chart to represent the ways energy is stored and transferred when an ice cube melts. Identify and circle the correct region on the heating curve and include initial and final particle pictures. Particle Picture Particle Picture (Initial) (Final) 45. One of the ice cubes described in the previous question is in placed in a glass of room temperature (25 ˚C) soda. Do separate bar charts for the ice cube and the soda. Ice Cube Soda 9 Directions: Use the Energy Bar graph below for questions #46-30. 46. What phase of matter is represented in the final conditions? a. Solid b. Liquid c. Gas 47. How would you describe the motion and arrangement of the particles from the initial to final conditions? a. Particles move slower and closer together . b. Particles move faster and farther apart. c. Particles move at the same speed and the same spacing. d. Not enough information. 48. Which term best describes what happens to this substance? a. Melting b. Freezing c. Condensing 49. d. Plasma d. Boiling What do you need to draw on the system circle between the energy bar graphs to represent the correct energy flow? a. An arrow into the system circle with 2 bars. b. An arrow into the system circle with 4 bars. c. An arrow out the system circle with 2 bars. d. An arrow out the system circle with 4 bars. Directions: For problems #50-52, include a sketch or either a heating or cooling curve. Show all work in your calculations, including the formula and units used. 50. Calculate the Joules of energy needed to heat 460 g of water from 5°C to 95°C. 51. How much energy is released when cooling 100 g of water from 25 °C to 7.5 °C? 10 52. Determine the amount of energy released when freezing 55 g of water. 53. A 60 g metal rod with an initial temperature of 75 °C gives off 1584 J of energy when placed in a calorimeter filled with water. The final temperature of both water and metal is 15 °C. Calculate the specific heat of the metal. 54. A piece of iron has a total mass of 48.0 grams. How many moles of iron atoms do they contain? 55. A raindrop has a mass of 6.01g. How many moles of water (H2O) does a raindrop contain? 56. How many molecules of water would you need to have 32.0 moles of H2O? 57. One box of Morton’s Salt contains 1.41 x 10²³ “formula units” of NaCl. How many moles of sodium chloride (NaCl) is this? 58. Calculate the mass percent % of oxygen, hydrogen, and carbon in baking soda (sodium bicarbonate, NaHCO3). 11 59. How many molecules of CO2 gas (carbon dioxide) are contained in a flask holding 55.0g of gas? CAUTION: This requires 2 differrent ratio calculation. 60. A flask contains 73.4 g of ammonia, NH3. a. How many moles of ammonia does it contain? b. How many molecules are present in the sample? 61 a. How many particles are in 1 mole of anything? b. Write a “For every… statement” for the number of atoms in 1 mole of gold. 62. Why do 1 mole of silver and 1 mole of platinum not have the same mass? 63. Draw a particle picture for solid iron, liquid water (H2O), and oxygen gas (O2). 64. Review and understand the Particle Picture T-notes worksheet on elements, compounds, and mixture (both types of mixtures), atom, molecule, diatomic, monatomic. Be able to draw a particle picture for each definition A B 12 C D E AB List all that apply: 1. Contains only diatomic elements. 2. Contains only compounds. 3. This box contains a pure compound. 4. Contains only elements (monatomic and diatomic). 5. This box contains a mixture of elements. 6. Contains only monatomic elements. 7. This box contains only a mixture of compounds 8. Contains only molecules. 9. This box contains a mixture of elements but no molecules. 10. Represents a mixture. 11. Contains a mixture of two monatomic elements. 65. Understand the separation techniques difference between mixtures versus compound. (Ws #1) 66. Distinguish between pure substance and mixtures A _________ substance has a definite set of characteristic properties (density, mp, bp), whereas a _________ exhibits properties that are a mixture of the properties of the substance they contain. A pure substance is composed of one ________of particle, whereas mixtures contain more than one kind of __________. 13 67. Describe how one could use differences in characteristic properties to separate the components of a mixture. Give 3 common examples used at home; type of separation technique ; and what physical property makes this technique possible. a. b. c. 68. Sketch particle diagrams that distinguish compounds, elements and mixtures Compound Element Mixture 69. Distinguish elements from compounds in terms of differences in their properties. 70. What is a diatomic element? Give 2 examples. 71. A container contains 57.6 g of baking soda (NaHCO3). 27.4% of that mass is sodium (Na). How much mass of sodium is that? 72. A similar chemical analysis is performed on a 500.0 g sample of the sugar isolated from a sample of pure sugar cane. Analysis shows this sample contains 211.0 g of carbon, 32.5 g of hydrogen, and 256.5 g of oxygen. Determine the percent composition by mass of each element in the sugar cane sample. 73. A compound is composed of 7.20 g of carbon, 1.20 g of hydrogen, and 9.60 g of oxygen. The molar mass of the compound in 180 g/mol. Determine the empirical and molecular formulas of this compound. 14


