HeatingCurves - AHS-HEMS
advertisement
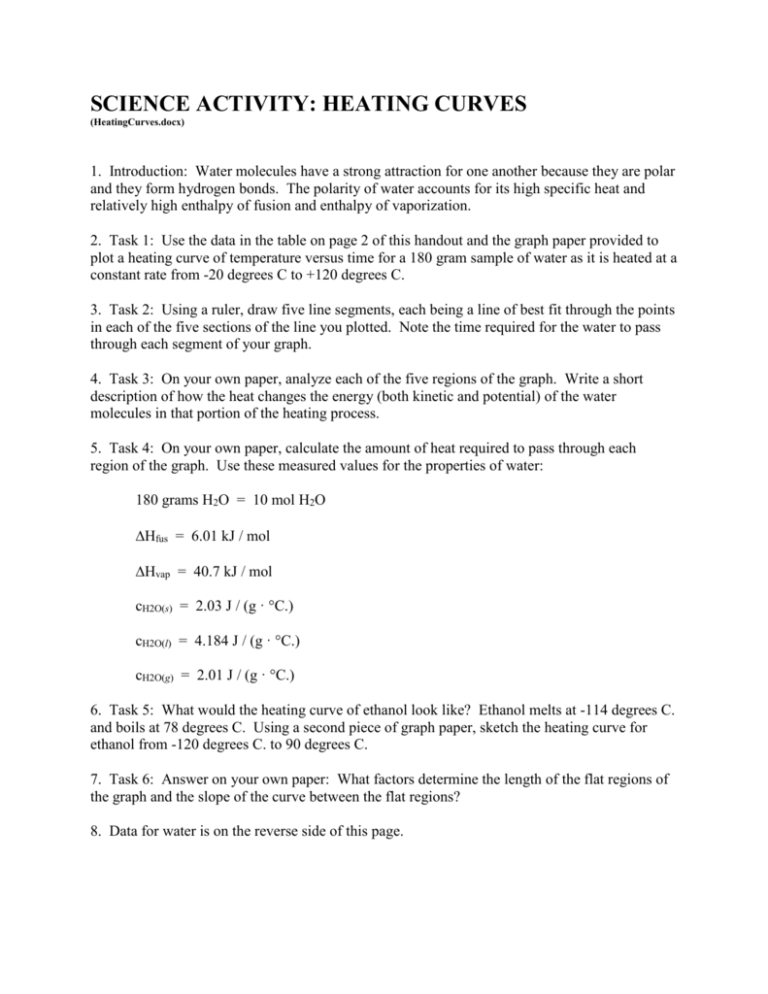
SCIENCE ACTIVITY: HEATING CURVES (HeatingCurves.docx) 1. Introduction: Water molecules have a strong attraction for one another because they are polar and they form hydrogen bonds. The polarity of water accounts for its high specific heat and relatively high enthalpy of fusion and enthalpy of vaporization. 2. Task 1: Use the data in the table on page 2 of this handout and the graph paper provided to plot a heating curve of temperature versus time for a 180 gram sample of water as it is heated at a constant rate from -20 degrees C to +120 degrees C. 3. Task 2: Using a ruler, draw five line segments, each being a line of best fit through the points in each of the five sections of the line you plotted. Note the time required for the water to pass through each segment of your graph. 4. Task 3: On your own paper, analyze each of the five regions of the graph. Write a short description of how the heat changes the energy (both kinetic and potential) of the water molecules in that portion of the heating process. 5. Task 4: On your own paper, calculate the amount of heat required to pass through each region of the graph. Use these measured values for the properties of water: 180 grams H2O = 10 mol H2O Hfus = 6.01 kJ / mol Hvap = 40.7 kJ / mol cH2O(s) = 2.03 J / (g · °C.) cH2O(l) = 4.184 J / (g · °C.) cH2O(g) = 2.01 J / (g · °C.) 6. Task 5: What would the heating curve of ethanol look like? Ethanol melts at -114 degrees C. and boils at 78 degrees C. Using a second piece of graph paper, sketch the heating curve for ethanol from -120 degrees C. to 90 degrees C. 7. Task 6: Answer on your own paper: What factors determine the length of the flat regions of the graph and the slope of the curve between the flat regions? 8. Data for water is on the reverse side of this page. Data for the Heating Curve of Water Time (min): Temperature (°C.): 0 -20 1 0 2 0 3 9 4 26 5 42 6 58 7 71 8 83 9 92 10 98 11 100 12 100 13 100 14 100 15 100 16 100 17 100 18 100 19 100 20 100 21 100 22 100 23 100 24 100 25 120 TEACHER NOTES: Heating Curve of Water 140 120 Temperature (deg C.) 100 80 60 40 20 0 0 5 10 15 -20 -40 Time (minutes) 20 25 30
