Heating Curves Worksheet: Phase Changes & States of Matter
advertisement
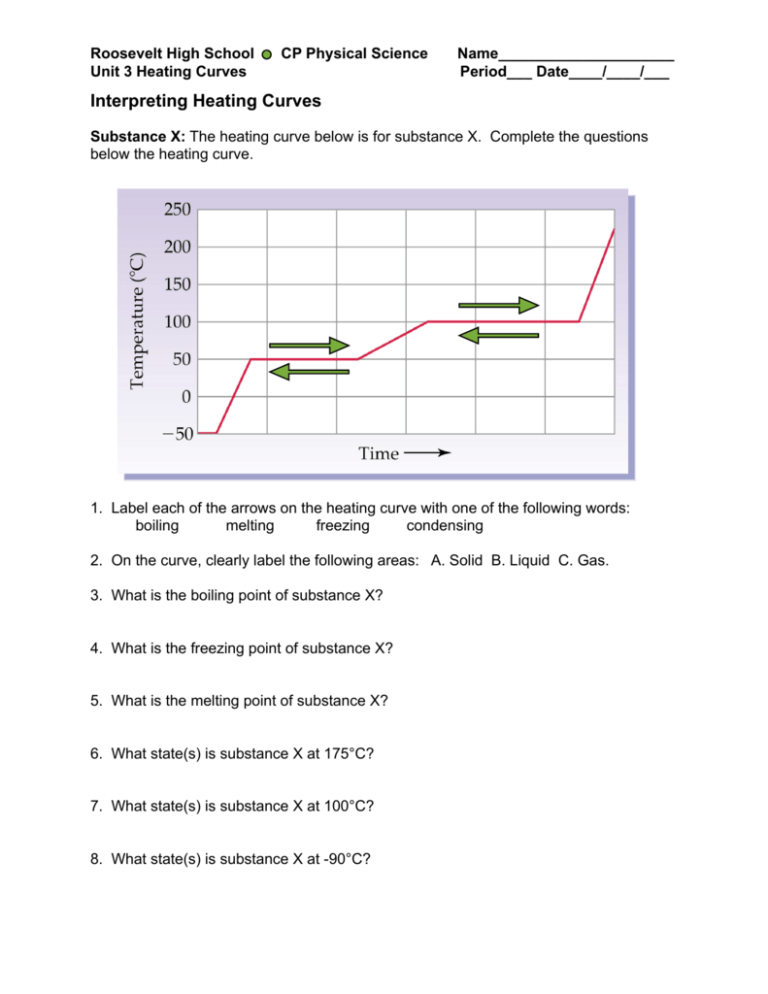
Roosevelt High School Unit 3 Heating Curves CP Physical Science Name_____________________ Period___ Date____/____/___ Interpreting Heating Curves Substance X: The heating curve below is for substance X. Complete the questions below the heating curve. Heat 1. Label each of the arrows on the heating curve with one of the following words: boiling melting freezing condensing 2. On the curve, clearly label the following areas: A. Solid B. Liquid C. Gas. 3. What is the boiling point of substance X? 4. What is the freezing point of substance X? 5. What is the melting point of substance X? 6. What state(s) is substance X at 175°C? 7. What state(s) is substance X at 100°C? 8. What state(s) is substance X at -90°C? Roosevelt High School Unit 3 Heating Curves CP Physical Science Name_____________________ Period___ Date____/____/___ 9. Assuming that a single particle of substance X could be drawn as a , sketch a picture of substance X between -50℃ and 50℃ and between 50℃ and 100℃ in the beakers below. -50℃ and 50℃ 50℃ and 100℃ Substance Y B 1. What two physical states of substance Y are present between B and C? 2. What two physical states of substance Y are present between D and E? Roosevelt High School Unit 3 Heating Curves CP Physical Science Name_____________________ Period___ Date____/____/___ For 3-6, name the phase change and state whether it is exothermic or endothermic. Number Phase Change Exothermic or Endothermic 3. B → C 4. C → B 5. D → E 6. E → D 7. Why is the heating curve for substance Y flat between B and C? 8. Describe how the particles in substance Y change between A and B? 9. The freezing point of ethanol is –114°C, and the boiling point is 78°C. Draw a heating curve for ethanol below, starting at -150°C and ending at 150°C. 150°C Temperature (°C) 100°C 50°C 0°C -50°C -100°C -150°C
