AP Statistics Project
advertisement
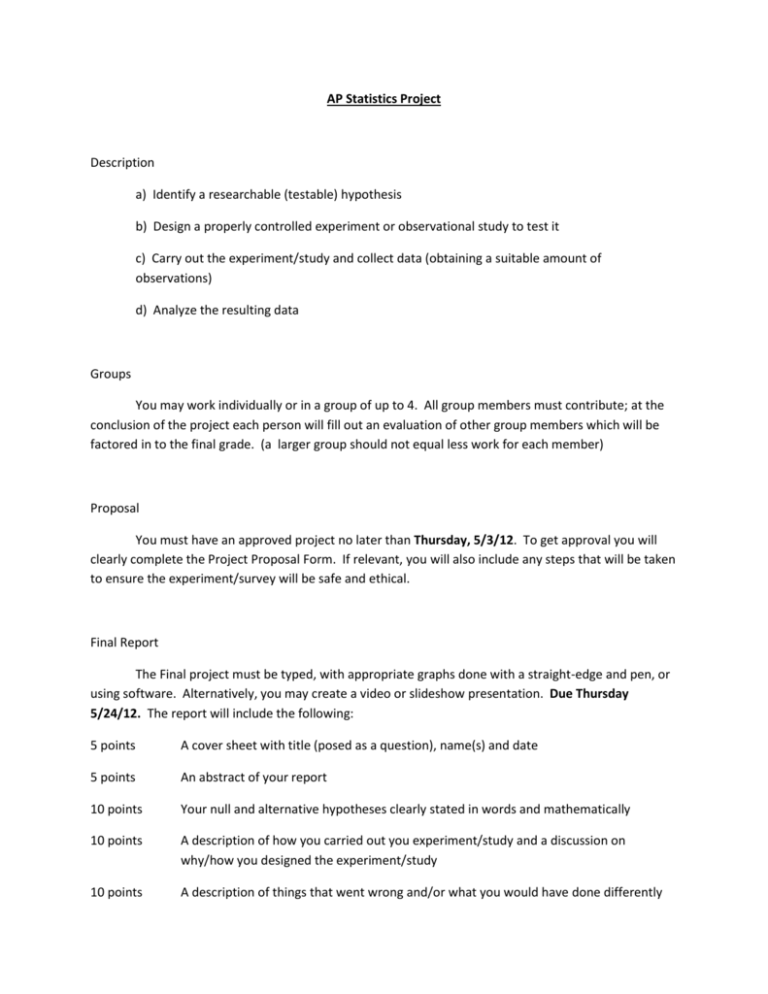
AP Statistics Project Description a) Identify a researchable (testable) hypothesis b) Design a properly controlled experiment or observational study to test it c) Carry out the experiment/study and collect data (obtaining a suitable amount of observations) d) Analyze the resulting data Groups You may work individually or in a group of up to 4. All group members must contribute; at the conclusion of the project each person will fill out an evaluation of other group members which will be factored in to the final grade. (a larger group should not equal less work for each member) Proposal You must have an approved project no later than Thursday, 5/3/12. To get approval you will clearly complete the Project Proposal Form. If relevant, you will also include any steps that will be taken to ensure the experiment/survey will be safe and ethical. Final Report The Final project must be typed, with appropriate graphs done with a straight-edge and pen, or using software. Alternatively, you may create a video or slideshow presentation. Due Thursday 5/24/12. The report will include the following: 5 points A cover sheet with title (posed as a question), name(s) and date 5 points An abstract of your report 10 points Your null and alternative hypotheses clearly stated in words and mathematically 10 points A description of how you carried out you experiment/study and a discussion on why/how you designed the experiment/study 10 points A description of things that went wrong and/or what you would have done differently 20 points A description of the statistical test you used to test your hypothesis and the reason for choosing that test. Show all calculations and find a P-value and/or confidence interval 10 points A conclusion about your hypothesis in statistical terms and using language that someone with no statistics knowledge would understand 10 points Appropriate format and all deadlines met Appendix: 10 points All the data you gathered displayed in a table. If applicable, include data summaries (means, standard deviations, 5-number summaries, etc) and a commentary on these summary statistics 10 points A graph (or several graphs) of your data and commentary on what it shows. Use a box plot, stem and leaf plot, scatterplot, histogram, pie chart, etc. I may want to keep your final report, so make a copy for yourself/selves if reasonable. Research Topic Ideas Does music enhance memory? Which golf ball travels furthest? What factors affect healthy plant growth? Personal space… how close is too close? Are Double Stuff Oreos really double stuffed? Do states with capital punishment have a lower homicide rate than those states without? Are all cartons of New York Super Fudge Chunk Ice Cream created equal? These are intended to inspire a topic that is interesting to YOU. Be creative, think of a question that you would actually like to answer, and will it hardly even seem like work! Good Luck!!
