Probability and Statistics – Uses and Misuses of Statistics: Word
advertisement
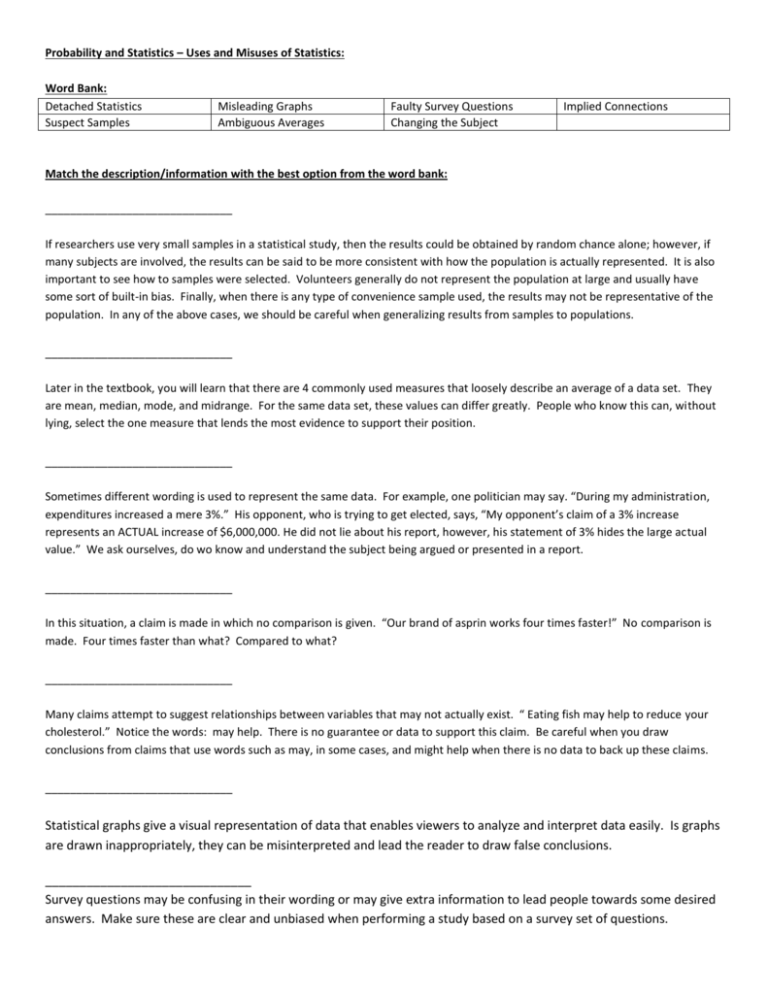
Probability and Statistics – Uses and Misuses of Statistics: Word Bank: Detached Statistics Suspect Samples Misleading Graphs Ambiguous Averages Faulty Survey Questions Changing the Subject Implied Connections Match the description/information with the best option from the word bank: ______________________________ If researchers use very small samples in a statistical study, then the results could be obtained by random chance alone; however, if many subjects are involved, the results can be said to be more consistent with how the population is actually represented. It is also important to see how to samples were selected. Volunteers generally do not represent the population at large and usually have some sort of built-in bias. Finally, when there is any type of convenience sample used, the results may not be representative of the population. In any of the above cases, we should be careful when generalizing results from samples to populations. ______________________________ Later in the textbook, you will learn that there are 4 commonly used measures that loosely describe an average of a data set. They are mean, median, mode, and midrange. For the same data set, these values can differ greatly. People who know this can, without lying, select the one measure that lends the most evidence to support their position. ______________________________ Sometimes different wording is used to represent the same data. For example, one politician may say. “During my administration, expenditures increased a mere 3%.” His opponent, who is trying to get elected, says, “My opponent’s claim of a 3% increase represents an ACTUAL increase of $6,000,000. He did not lie about his report, however, his statement of 3% hides the large actual value.” We ask ourselves, do wo know and understand the subject being argued or presented in a report. ______________________________ In this situation, a claim is made in which no comparison is given. “Our brand of asprin works four times faster!” No comparison is made. Four times faster than what? Compared to what? ______________________________ Many claims attempt to suggest relationships between variables that may not actually exist. “ Eating fish may help to reduce your cholesterol.” Notice the words: may help. There is no guarantee or data to support this claim. Be careful when you draw conclusions from claims that use words such as may, in some cases, and might help when there is no data to back up these claims. ______________________________ Statistical graphs give a visual representation of data that enables viewers to analyze and interpret data easily. Is graphs are drawn inappropriately, they can be misinterpreted and lead the reader to draw false conclusions. ______________________________ Survey questions may be confusing in their wording or may give extra information to lead people towards some desired answers. Make sure these are clear and unbiased when performing a study based on a survey set of questions.


