Name Worksheet 3
advertisement
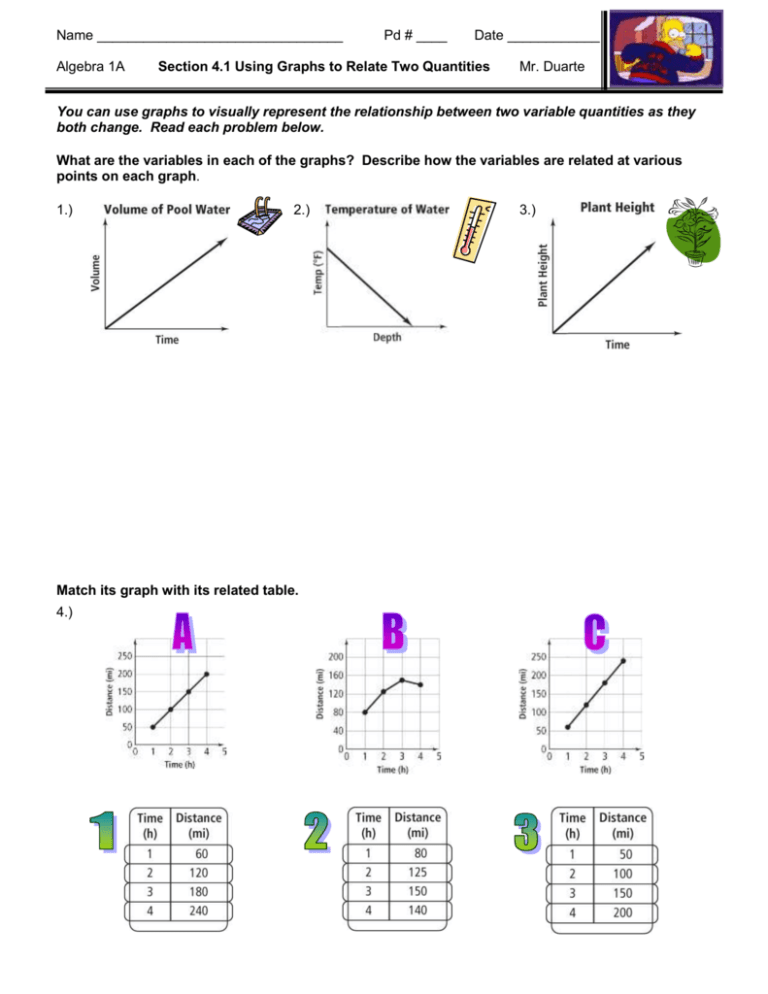
Name ________________________________ Algebra 1A Pd # ____ Date ____________ Section 4.1 Using Graphs to Relate Two Quantities Mr. Duarte You can use graphs to visually represent the relationship between two variable quantities as they both change. Read each problem below. What are the variables in each of the graphs? Describe how the variables are related at various points on each graph. 1.) 2.) Match its graph with its related table. 4.) 3.) Sketch a graph for each situation. 5.) You buy two shirts and the third one is free. 6.) The temperature warms up during the day and then decreases at night. Pgs. 237 – 238 #1, 5 – 11 all & #13


