Biology Ch. 1 Scientific Method
advertisement
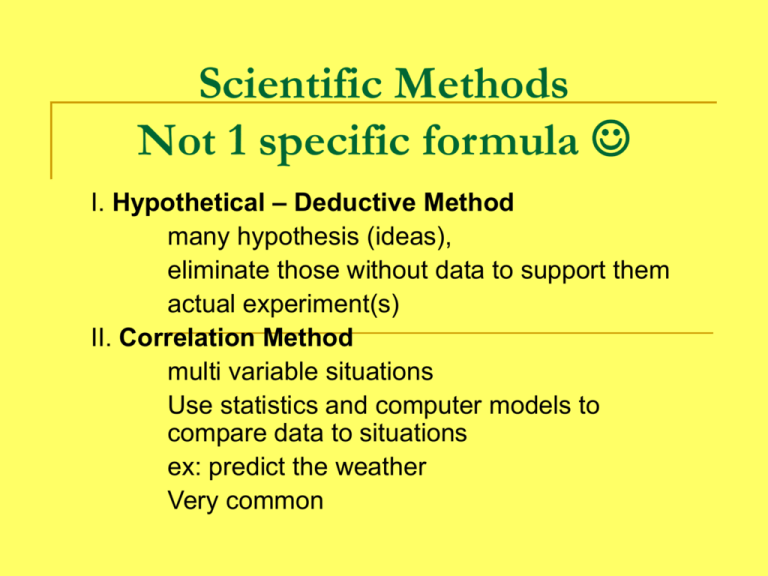
Scientific Methods Not 1 specific formula I. Hypothetical – Deductive Method many hypothesis (ideas), eliminate those without data to support them actual experiment(s) II. Correlation Method multi variable situations Use statistics and computer models to compare data to situations ex: predict the weather Very common Steps in (a) Scientific Method (Hypothetical – deductive) Used more like a flow chart than a list 1. Observation Curiosity, skepticism, senses/ observations, experiences 2. Question “Why? , How? , What if? “ 3. Research background information , look for an answer, list all possible explanations, what you already know 4. Hypothesis “If – then – therefore” statement, cause and effect, educated guess, prediction, testable/ measurable, “explanation on trial”… claims and statements Scientific method continued 5. Design an Experiment Independent variable – “manipulated variable” I/ the scientist manipulate or investigate, only 1, the “IF”.., what is being tested/varied/modified/changed by the researcher, x axis Dependent variable – “responding variable” depends on what I did (independent)… plant is TALLER because of the fertilizer, “Then”, what is measured/changes, y axis Controls – everything you keep the same so that there is only one independent variable., comparison/ base line, ‘control group’ Scientific method continued 6. Collect data (during and after experiment) numbers and units – quantitative data (quantity or amount), descriptions = qualitative data (quality of something) 7. Analyze data Put into tables, charts, graphs, look for TRENDS and correlations between Ind.V and Dep. V., relationships. Show work, calculations and formulas Either verify or falsify your claim with these steps– retest, restart, restate, re-evaluate … ask more questions and do it again…. LOOPS ! 8. Conclusion Does your data show support for your prediction…. Accept Hypothesis or declare Null Hypothesis. Explain what happened, what your results were and where you could improve/change (error analysis is statistical work done to show the precision of your measurements) Do not say “Prove” – you didn’t prove 100% forever, you supported or eliminated, until there is new evidence 9. Repeat/ report/ publish Lab report or publication – grant money, peer review, share results, more testing, etc. Assignment – this may be done individually or in collaboration with a partner (BOTH write and submit) 1. on a sheet of plain paper (or your iPad) create a flow chart version of the steps usually covered in any scientific What was the hypothesis or experiment. claim? Set up/ control 2. Read page 29 - 31 and list the group, procedure steps taken by Rita Colwell to verify or Independent correlate that water temperature is an variable, indicator of cholera risk. (Might loop) dependent variable, data or results, 3. Choose an article from the red Conclusion/ folders provided and list the steps eliminate or support taken during a classic experiment (Redi, Lister, Pasteur, Jenner, etc)


