ARBK update Aug 2010 - Al-Hekma For Financial Services
advertisement
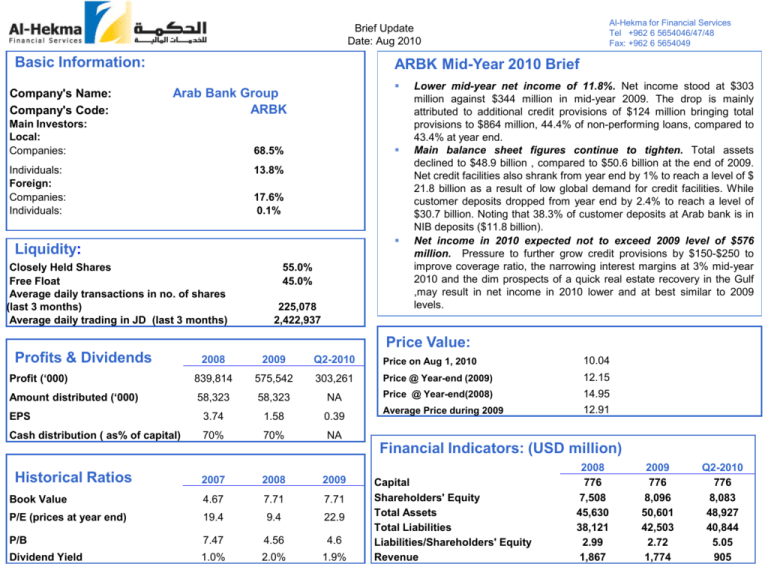
Al-Hekma for Financial Services Tel +962 6 5654046/47/48 Fax: +962 6 5654049 Brief Update Date: Aug 2010 Basic Information: Company's Name: Company's Code: ARBK Mid-Year 2010 Brief Arab Bank Group ARBK Main Investors: Local: Companies: 68.5% Individuals: Foreign: Companies: Individuals: 13.8% 17.6% 0.1% Liquidity: Closely Held Shares Free Float Average daily transactions in no. of shares (last 3 months) Average daily trading in JD (last 3 months) 55.0% 45.0% 225,078 2,422,937 Lower mid-year net income of 11.8%. Net income stood at $303 million against $344 million in mid-year 2009. The drop is mainly attributed to additional credit provisions of $124 million bringing total provisions to $864 million, 44.4% of non-performing loans, compared to 43.4% at year end. Main balance sheet figures continue to tighten. Total assets declined to $48.9 billion , compared to $50.6 billion at the end of 2009. Net credit facilities also shrank from year end by 1% to reach a level of $ 21.8 billion as a result of low global demand for credit facilities. While customer deposits dropped from year end by 2.4% to reach a level of $30.7 billion. Noting that 38.3% of customer deposits at Arab bank is in NIB deposits ($11.8 billion). Net income in 2010 expected not to exceed 2009 level of $576 million. Pressure to further grow credit provisions by $150-$250 to improve coverage ratio, the narrowing interest margins at 3% mid-year 2010 and the dim prospects of a quick real estate recovery in the Gulf ,may result in net income in 2010 lower and at best similar to 2009 levels. Price Value: Profits & Dividends 2008 2009 Q2-2010 Price on Aug 1, 2010 10.04 Profit (‘000) 839,814 575,542 303,261 Price @ Year-end (2009) 12.15 Amount distributed (‘000) 58,323 58,323 NA Price @ Year-end(2008) 14.95 EPS 3.74 1.58 0.39 Average Price during 2009 12.91 Cash distribution ( as% of capital) 70% 70% NA Financial Indicators: (USD million) Historical Ratios 2007 2008 2009 Book Value 4.67 7.71 7.71 P/E (prices at year end) 19.4 9.4 22.9 P/B 7.47 4.56 4.6 Dividend Yield 1.0% 2.0% 1.9% Capital Shareholders' Equity Total Assets Total Liabilities Liabilities/Shareholders' Equity Revenue 2008 776 7,508 45,630 38,121 2.99 1,867 2009 776 8,096 50,601 42,503 2.72 1,774 Q2-2010 776 8,083 48,927 40,844 5.05 905
