Condition and Performance of Domestic Banks
advertisement

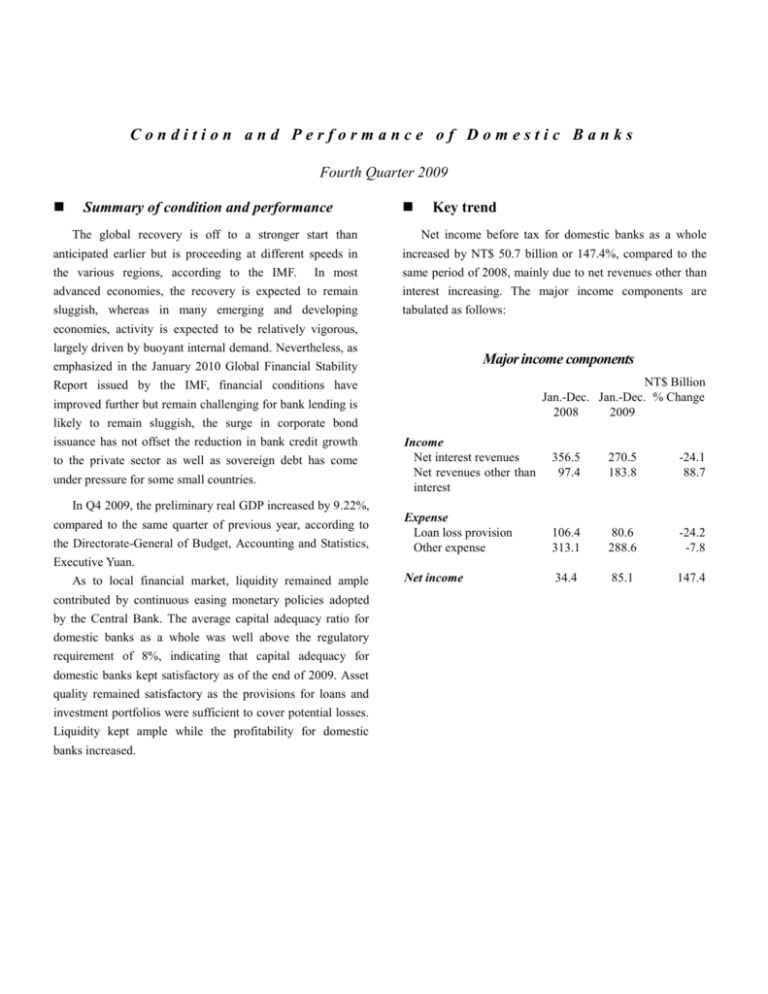
Condition and Performance of Domestic Banks Fourth Quarter 2009 Summary of condition and performance Key trend The global recovery is off to a stronger start than Net income before tax for domestic banks as a whole anticipated earlier but is proceeding at different speeds in increased by NT$ 50.7 billion or 147.4%, compared to the the various regions, according to the IMF. In most same period of 2008, mainly due to net revenues other than advanced economies, the recovery is expected to remain interest increasing. The major income components are sluggish, whereas in many emerging and developing tabulated as follows: economies, activity is expected to be relatively vigorous, largely driven by buoyant internal demand. Nevertheless, as Major income components emphasized in the January 2010 Global Financial Stability NT$ Billion Jan.-Dec. Jan.-Dec. % Change 2008 2009 Report issued by the IMF, financial conditions have improved further but remain challenging for bank lending is likely to remain sluggish, the surge in corporate bond issuance has not offset the reduction in bank credit growth to the private sector as well as sovereign debt has come under pressure for some small countries. Income Net interest revenues Net revenues other than interest 356.5 97.4 270.5 183.8 -24.1 88.7 Expense Loan loss provision Other expense 106.4 313.1 80.6 288.6 -24.2 -7.8 Net income 34.4 85.1 147.4 In Q4 2009, the preliminary real GDP increased by 9.22%, compared to the same quarter of previous year, according to the Directorate-General of Budget, Accounting and Statistics, Executive Yuan. As to local financial market, liquidity remained ample contributed by continuous easing monetary policies adopted by the Central Bank. The average capital adequacy ratio for domestic banks as a whole was well above the regulatory requirement of 8%, indicating that capital adequacy for domestic banks kept satisfactory as of the end of 2009. Asset quality remained satisfactory as the provisions for loans and investment portfolios were sufficient to cover potential losses. Liquidity kept ample while the profitability for domestic banks increased. Net interest margin(NIM)increased Net Interest Margin chart 1 NT$ billion NIM reported NT$ 73.7 billion for this quarter, increasing by NT$8.6 billion or 13.2% compared to the previous quarter. (Chart 1) 120.0 110.0 100.0 90.0 80.0 70.0 60.0 50.0 06 07 08 09 Data are on a quarterly basis Deposits chart 2 Deposits increased moderately in NT$ billion 28,000 As of end-December 2009, total deposits amounted to NT$24,928.3 billion, increasing by NT$ 648.8 billion, 26,500 25,000 23,500 compared to the previous quarter. The annual growth rate of total deposits was 4.52% down from 6.14% in 2008 Q4. 22,000 20,500 19,000 (Chart 2) 17,500 16,000 04 05 06 07 08 09 Data are on a quarterly basis chart 3 Loans Loans increased slightly in NT$ billion 20,000 Total loans amounted to NT$ 18,724.1 billion as of end-December 2009, increasing slightly by NT$ 358.1 billion or 1.95% compared to previous quarter, reflecting 19,000 18,000 that domestic banks became more proactive in credit 17,000 extension. of total loans 16,000 registered –0.30%, moderately decreased by 2.30 percentage 15,000 The annual growth rate points from 2.00% in end-December 2008. (Chart 3) 04 05 06 07 08 09 Data are on a quarterly basis chart 4 Investments in NT$ billion 5,000 Investments increased slightly 4,500 Total investments reached NT$ 4,736.5 billion, increasing by NT$104.2 billion or 2.25 %, compared to the 4,000 previous quarter, mainly due to an increasing in purchasing Negotiable Certificate of Deposits (NCDs) issued by CBC. (Chart 4) 3,500 04 05 Data are on a quarterly basis 06 07 08 09 Asset quality remained satisfactory NPL ratio chart5 % 16.0 14.0 The average NPL ratio stood at 1.15% as of 12.0 end-December 2009, decreasing by 0.23 percentage points 10.0 from the previous quarter. Asset quality for the overall 8.0 6.0 banking sector kept satisfactory. The average provision 4.0 coverage ratio was 95.7%, 12.95 percentage points up from 2.0 - 82.75% as of the previous quarter’s end. 01 02 03 04 05 06 07 08 09 Data are on a quarterly basis chart 6 Provision-to-loan ratio decreased slightly The provision-to-loan ratio was 1.04 ﹪ Provision-to-loan ratio as of % 2.50 2.30 end-December 2009, slightly decreased by 0.05 percentage points down from 1.09﹪ at the end of previous quarter. (Chart 6) 2.10 1.90 1.70 1.50 1.30 1.10 0.90 0.70 04 05 06 07 08 09 Data are on a quarterly basis Liquidity kept ample Every domestic bank met the regulatory liquidity ratio requirement of 7% in December 2009. The average liquidity 28.0 ratio was 26.18% for domestic banks as a whole, increasing 26.0 by 1.53 percentage points, compared to the previous quarter. Liquidity Ratio chart7 % 24.0 22.0 Liquidity for domestic banking sector kept ample. (Chart 7) 20.0 18.0 16.0 14.0 04 05 06 07 08 09 Data are on a quarterly basis Average capital adequacy ratio increased chart 8 The average BIS capital adequacy ratio was 11.85% as Capital Adequacy Ratio % of end-December 2009 on arithmetic mean, increasing by 12.50 0.30 percentage points from 11.55% at end-September 2009. 12.00 Capital adequacy for most domestic banks remained 11.50 satisfactory. (Chart 8) 11.00 10.50 10.00 01 06 Data are on a quarterly basis 07 08 09 錯誤! 連結 無效。


