climograph assign applied
advertisement
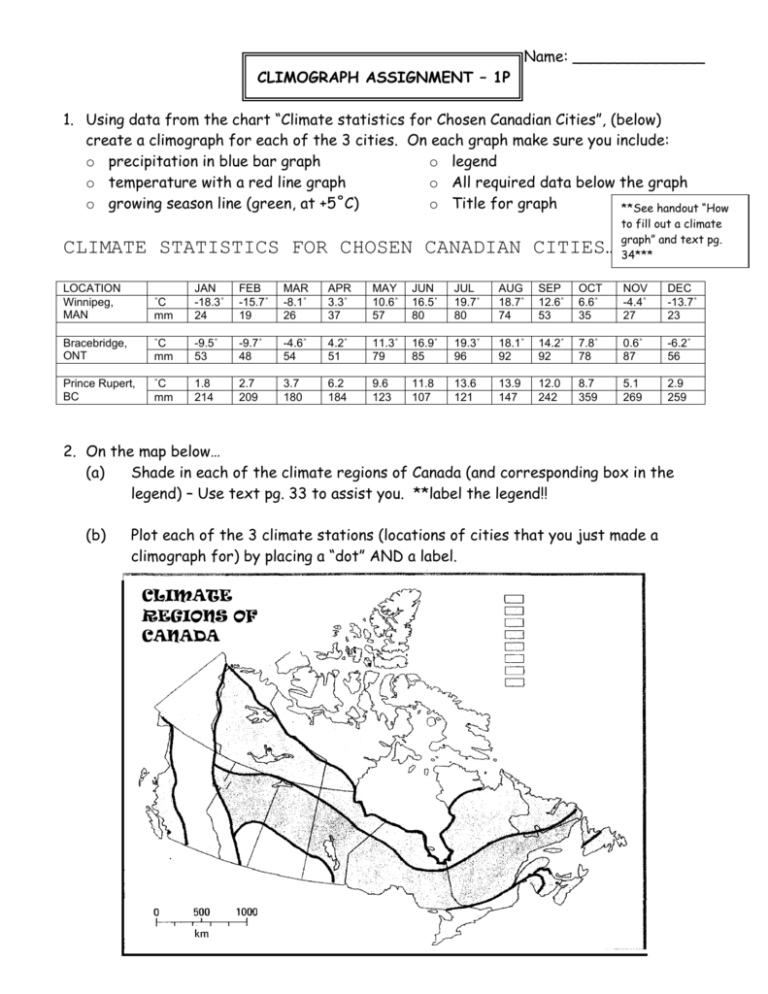
CLIMOGRAPH ASSIGNMENT – 1P Name: ______________ 1. Using data from the chart “Climate statistics for Chosen Canadian Cities”, (below) create a climograph for each of the 3 cities. On each graph make sure you include: o precipitation in blue bar graph o legend o temperature with a red line graph o All required data below the graph o growing season line (green, at +5˚C) o Title for graph **See handout “How to fill out a climate graph” and text pg. 34*** CLIMATE STATISTICS FOR CHOSEN CANADIAN CITIES…. LOCATION Winnipeg, MAN ˚C mm JAN -18.3˚ 24 FEB -15.7˚ 19 MAR -8.1˚ 26 APR 3.3˚ 37 MAY 10.6˚ 57 JUN 16.5˚ 80 JUL 19.7˚ 80 AUG 18.7˚ 74 SEP 12.6˚ 53 OCT 6.6˚ 35 NOV -4.4˚ 27 DEC -13.7˚ 23 Bracebridge, ONT ˚C mm -9.5˚ 53 -9.7˚ 48 -4.6˚ 54 4.2˚ 51 11.3˚ 79 16.9˚ 85 19.3˚ 96 18.1˚ 92 14.2˚ 92 7.8˚ 78 0.6˚ 87 -6.2˚ 56 Prince Rupert, BC ˚C mm 1.8 214 2.7 209 3.7 180 6.2 184 9.6 123 11.8 107 13.6 121 13.9 147 12.0 242 8.7 359 5.1 269 2.9 259 2. On the map below… (a) Shade in each of the climate regions of Canada (and corresponding box in the legend) – Use text pg. 33 to assist you. **label the legend!! (b) Plot each of the 3 climate stations (locations of cities that you just made a climograph for) by placing a “dot” AND a label. CLIMATE REGIONS OF CANADA USE YOUR COMPLETED CLIMOGRAPHS TO HELP ANSWER THE REMAINING QUESTIONS ***TYPE answers if possible (this chart is on the class website) 3. Complete the charts below to describe each of the 3 climate stations. Please write in full sentences!! CITY: WINNIPEG What climate region is this city in? What climate TYPE would this city be classified as? (Continental or Maritime) Describe the temperature in this area. (Eg: include the temperature range, summer winter temp) Describe the precipitation in this area. (What months get the most precipitation, what is the total annual precipitation?) How many months long is the growing season? BEFORE CONTINUING HAVE YOUR WORK CHECKED BY MRS. SMITH TO MAKE SURE YOU’VE INCLUDED ALL CRITERIA! CITY: BRACEBRIDGE What climate region is this city in? What climate TYPE would this city be classified as? (Continental or Maritime) Describe the temperature in this area. (Eg: include the temperature range, summer winter temp) Describe the precipitation in this area. (What months get the most precipitation, what is the total annual precipitation?) How many months long is the growing season? CITY: PRINCE RUPERT What climate region is this city in? What climate TYPE would this city be classified as? (Continental or Maritime) Describe the temperature in this area. (Eg: include the temperature range, summer winter temp) Describe the precipitation in this area. (What months get the most precipitation, what is the total annual precipitation?) How many months long is the growing season? 4. Using the total precipitation, rank the climate stations in descending order (high to low). Beside each city name, write the precipitation in mm. CITY NAME AMOUNT OF PRECIPITATION (mm) #1 (City with the highest total precipitation) #2 (City with the middle amount of total precipitation) #3 (City with the lowest total precipitation) 5. Using summer temperatures (June, July, August), rank the stations from warmest to coolest. CITY NAME Summer temperatures (June + July + August)÷3 =___ Warmest Middle Coolest 6. Using the information you have discovered in questions 1-7, which of these climate regions do you think you would like to live in? Explain your choice. 7. Design a title page for your assignment. Make sure it includes a title, your name, my name, date handed in and the class code (CGC 1D – Block ___) THIS ASSIGNMENT IS DUE BY .


