How to Read a Climograph: Climate Graphs Explained
Hunter College of the City University of New York
Department of Geography
How to Read a Climograph
Climate is the average of daily weather conditions at a particular location. A climograph or climate graph is a visual representation of average monthly conditions at a location over the course of a year. It focuses on average monthly temperature and average monthly precipitation.
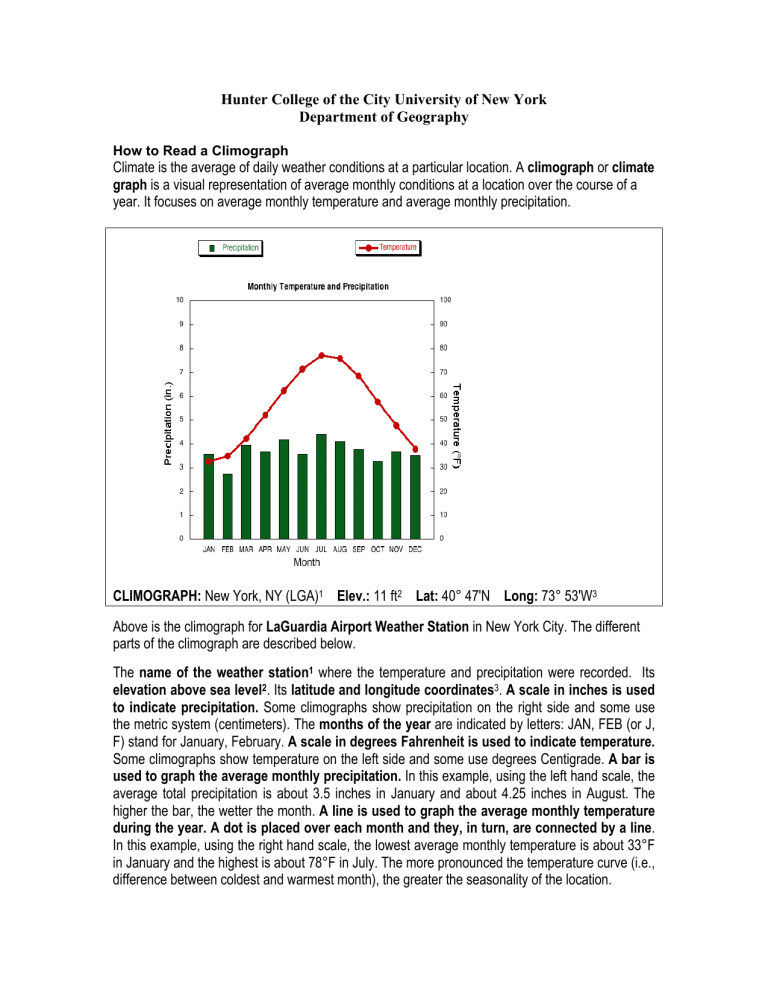
CLIMOGRAPH: New York, NY (LGA) 1 Elev.: 11 ft 2 Lat: 40° 47'N Long: 73° 53'W 3
Above is the climograph for LaGuardia Airport Weather Station in New York City. The different parts of the climograph are described below.
The name of the weather station 1 where the temperature and precipitation were recorded. Its elevation above sea level 2 . Its latitude and longitude coordinates 3 . A scale in inches is used to indicate precipitation.
Some climographs show precipitation on the right side and some use the metric system (centimeters). The months of the year are indicated by letters: JAN, FEB (or J,
F) stand for January, February. A scale in degrees Fahrenheit is used to indicate temperature.
Some climographs show temperature on the left side and some use degrees Centigrade. A bar is used to graph the average monthly precipitation.
In this example, using the left hand scale, the average total precipitation is about 3.5 inches in January and about 4.25 inches in August. The higher the bar, the wetter the month. A line is used to graph the average monthly temperature during the year. A dot is placed over each month and they, in turn, are connected by a line .
In this example, using the right hand scale, the lowest average monthly temperature is about 33°F in January and the highest is about 78°F in July. The more pronounced the temperature curve (i.e., difference between coldest and warmest month), the greater the seasonality of the location.
