AP Stats
advertisement
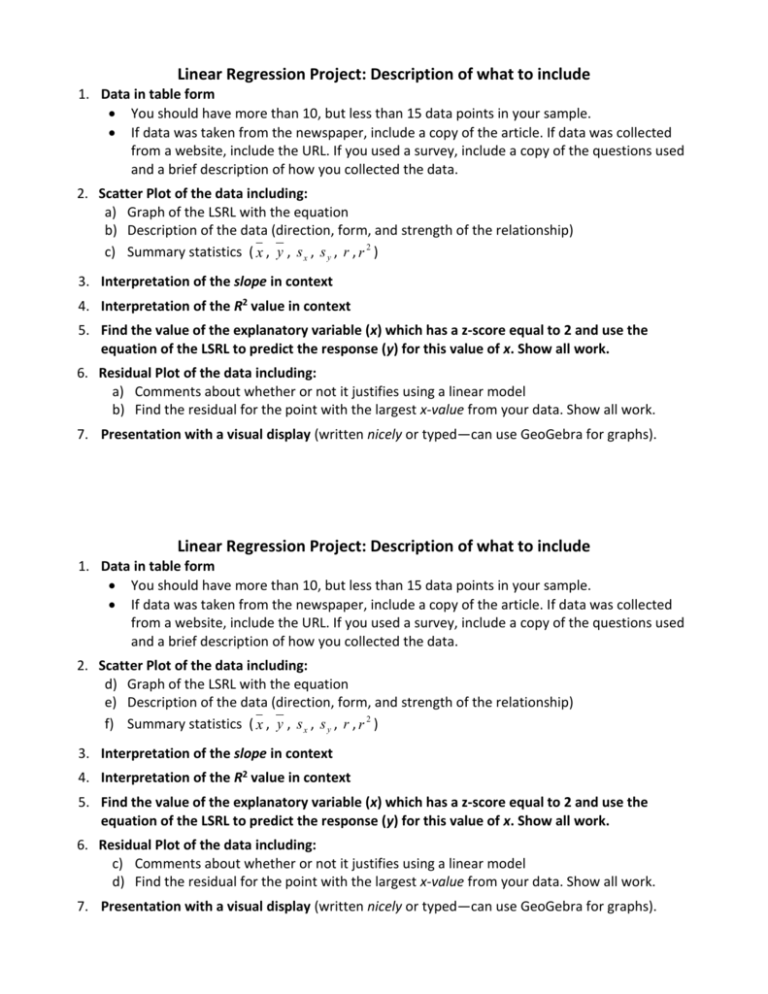
Linear Regression Project: Description of what to include 1. Data in table form You should have more than 10, but less than 15 data points in your sample. If data was taken from the newspaper, include a copy of the article. If data was collected from a website, include the URL. If you used a survey, include a copy of the questions used and a brief description of how you collected the data. 2. Scatter Plot of the data including: a) Graph of the LSRL with the equation b) Description of the data (direction, form, and strength of the relationship) c) Summary statistics ( x , y , s x , s y , r , r 2 ) 3. Interpretation of the slope in context 4. Interpretation of the R2 value in context 5. Find the value of the explanatory variable (x) which has a z-score equal to 2 and use the equation of the LSRL to predict the response (y) for this value of x. Show all work. 6. Residual Plot of the data including: a) Comments about whether or not it justifies using a linear model b) Find the residual for the point with the largest x-value from your data. Show all work. 7. Presentation with a visual display (written nicely or typed—can use GeoGebra for graphs). Linear Regression Project: Description of what to include 1. Data in table form You should have more than 10, but less than 15 data points in your sample. If data was taken from the newspaper, include a copy of the article. If data was collected from a website, include the URL. If you used a survey, include a copy of the questions used and a brief description of how you collected the data. 2. Scatter Plot of the data including: d) Graph of the LSRL with the equation e) Description of the data (direction, form, and strength of the relationship) f) Summary statistics ( x , y , s x , s y , r , r 2 ) 3. Interpretation of the slope in context 4. Interpretation of the R2 value in context 5. Find the value of the explanatory variable (x) which has a z-score equal to 2 and use the equation of the LSRL to predict the response (y) for this value of x. Show all work. 6. Residual Plot of the data including: c) Comments about whether or not it justifies using a linear model d) Find the residual for the point with the largest x-value from your data. Show all work. 7. Presentation with a visual display (written nicely or typed—can use GeoGebra for graphs). Linear Regression Project: Grading Rubric Item Comments: Points 1 0 1 2 3 2A 0 1 2 2B 0 1 2 3 4 5 2C 0 1 2 3 0 1 2 3 4 0 1 2 3 5 0 1 2 3 6A 0 1 2 3 6B 0 1 2 3 7 0 1 2 3 4 5 /32 Total: Linear Regression Project: Grading Rubric Item Comments: Points 1 0 1 2 3 2A 0 1 2 2B 0 1 2 3 4 5 2C 0 1 2 3 0 1 2 3 4 0 1 2 3 5 0 1 2 3 6A 0 1 2 3 6B 0 1 2 3 7 0 1 2 3 4 5 Total: Name__________________________ /32 Name__________________________

