AP Statistics Ch 4 Review Answers
advertisement
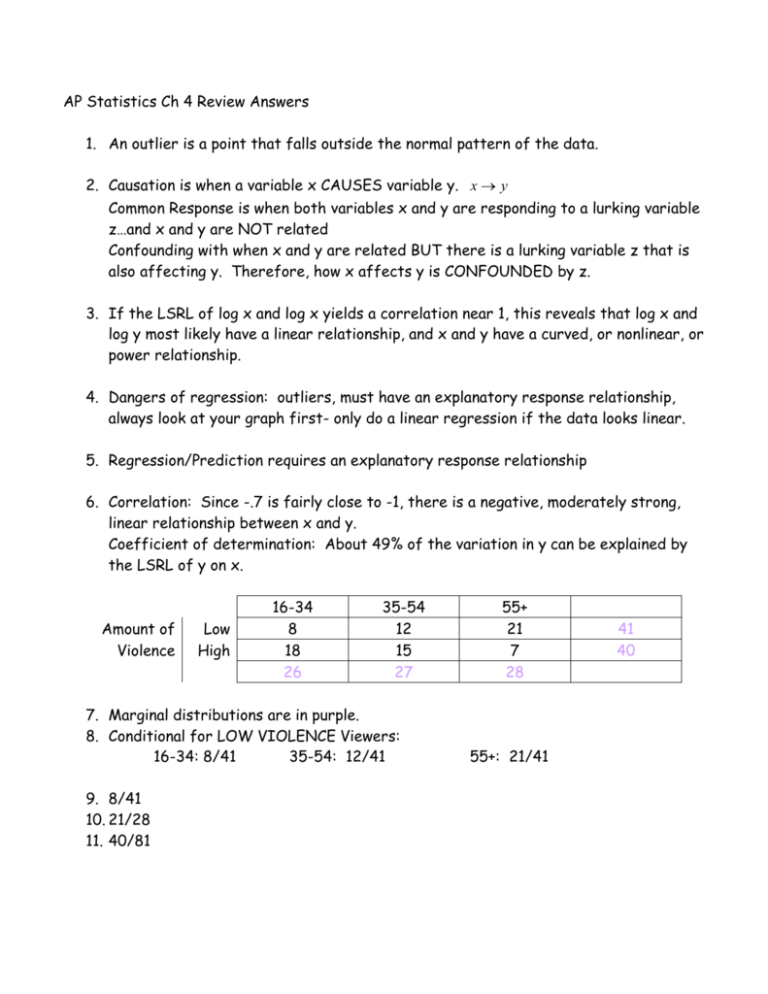
AP Statistics Ch 4 Review Answers 1. An outlier is a point that falls outside the normal pattern of the data. 2. Causation is when a variable x CAUSES variable y. x y Common Response is when both variables x and y are responding to a lurking variable z…and x and y are NOT related Confounding with when x and y are related BUT there is a lurking variable z that is also affecting y. Therefore, how x affects y is CONFOUNDED by z. 3. If the LSRL of log x and log x yields a correlation near 1, this reveals that log x and log y most likely have a linear relationship, and x and y have a curved, or nonlinear, or power relationship. 4. Dangers of regression: outliers, must have an explanatory response relationship, always look at your graph first- only do a linear regression if the data looks linear. 5. Regression/Prediction requires an explanatory response relationship 6. Correlation: Since -.7 is fairly close to -1, there is a negative, moderately strong, linear relationship between x and y. Coefficient of determination: About 49% of the variation in y can be explained by the LSRL of y on x. Amount of Violence Low High 16-34 8 18 26 35-54 12 15 27 7. Marginal distributions are in purple. 8. Conditional for LOW VIOLENCE Viewers: 16-34: 8/41 35-54: 12/41 9. 8/41 10. 21/28 11. 40/81 55+ 21 7 28 55+: 21/41 41 40 12. The ratios of the spending are fairly constant (between 1.5 and 2.2) so I’m going to use an exponential graph. Also, when you log the spending, the graph of year and log spending looked linear. The LSRL through the year and log spending is: lo ĝ spending 1.00 .052 year The model for the original data is spenˆding 101.00 10.052 year For 1988: spenˆding 101.00 10.052(88) 376703.8 For 1990: spenˆding 101.00 10.052(90) 478630.09 , so the residual (Actual – Predicted) = 422257 – 478630 = -56373
