Algebra 2 Linear Data Project: Data Collection & Analysis
advertisement
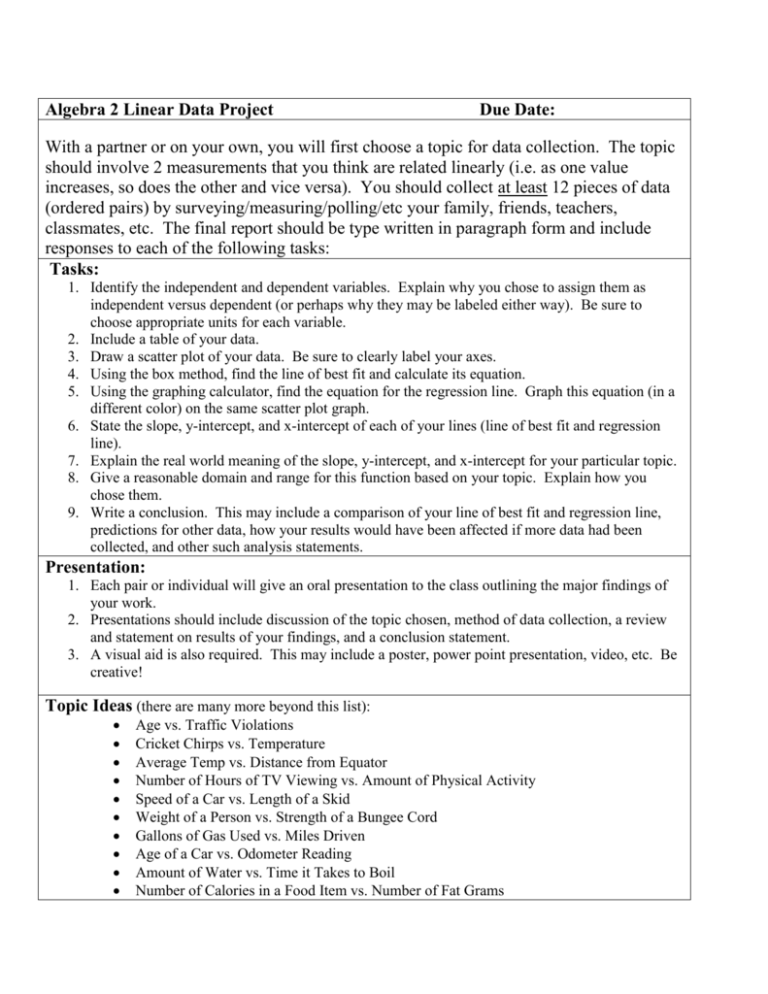
Algebra 2 Linear Data Project Due Date: With a partner or on your own, you will first choose a topic for data collection. The topic should involve 2 measurements that you think are related linearly (i.e. as one value increases, so does the other and vice versa). You should collect at least 12 pieces of data (ordered pairs) by surveying/measuring/polling/etc your family, friends, teachers, classmates, etc. The final report should be type written in paragraph form and include responses to each of the following tasks: Tasks: 1. Identify the independent and dependent variables. Explain why you chose to assign them as independent versus dependent (or perhaps why they may be labeled either way). Be sure to choose appropriate units for each variable. 2. Include a table of your data. 3. Draw a scatter plot of your data. Be sure to clearly label your axes. 4. Using the box method, find the line of best fit and calculate its equation. 5. Using the graphing calculator, find the equation for the regression line. Graph this equation (in a different color) on the same scatter plot graph. 6. State the slope, y-intercept, and x-intercept of each of your lines (line of best fit and regression line). 7. Explain the real world meaning of the slope, y-intercept, and x-intercept for your particular topic. 8. Give a reasonable domain and range for this function based on your topic. Explain how you chose them. 9. Write a conclusion. This may include a comparison of your line of best fit and regression line, predictions for other data, how your results would have been affected if more data had been collected, and other such analysis statements. Presentation: 1. Each pair or individual will give an oral presentation to the class outlining the major findings of your work. 2. Presentations should include discussion of the topic chosen, method of data collection, a review and statement on results of your findings, and a conclusion statement. 3. A visual aid is also required. This may include a poster, power point presentation, video, etc. Be creative! Topic Ideas (there are many more beyond this list): Age vs. Traffic Violations Cricket Chirps vs. Temperature Average Temp vs. Distance from Equator Number of Hours of TV Viewing vs. Amount of Physical Activity Speed of a Car vs. Length of a Skid Weight of a Person vs. Strength of a Bungee Cord Gallons of Gas Used vs. Miles Driven Age of a Car vs. Odometer Reading Amount of Water vs. Time it Takes to Boil Number of Calories in a Food Item vs. Number of Fat Grams

