Project Analysis: Answer Key - NPV, Sensitivity, Options
advertisement
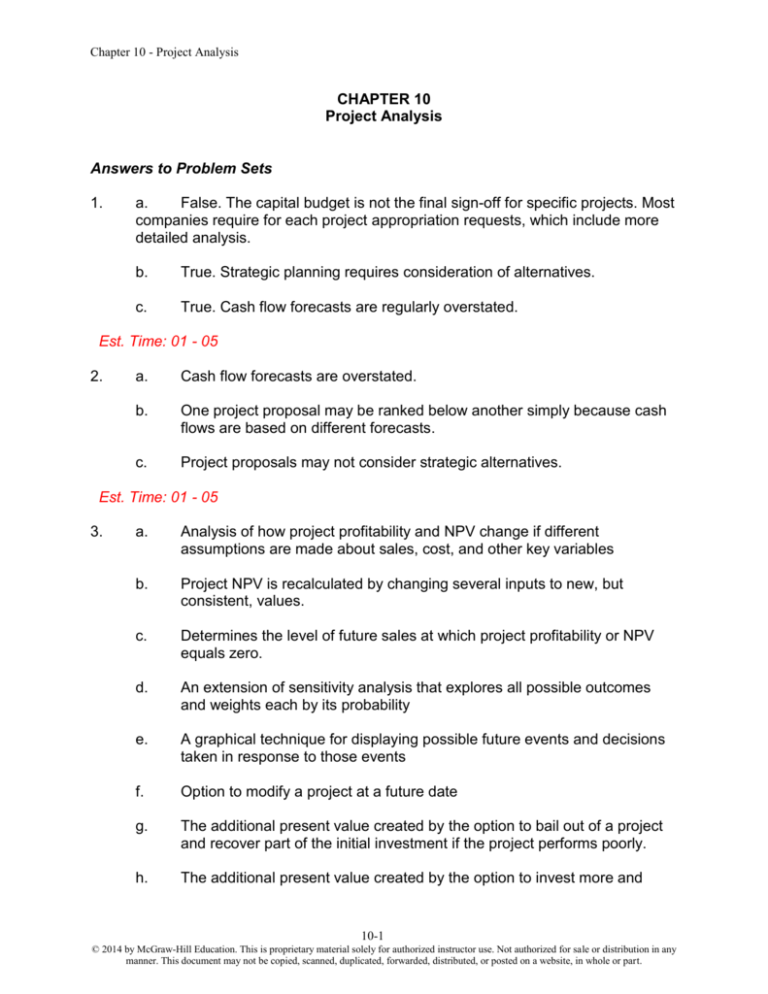
Chapter 10 - Project Analysis CHAPTER 10 Project Analysis Answers to Problem Sets 1. a. False. The capital budget is not the final sign-off for specific projects. Most companies require for each project appropriation requests, which include more detailed analysis. b. True. Strategic planning requires consideration of alternatives. c. True. Cash flow forecasts are regularly overstated. Est. Time: 01 - 05 2. a. Cash flow forecasts are overstated. b. One project proposal may be ranked below another simply because cash flows are based on different forecasts. c. Project proposals may not consider strategic alternatives. Est. Time: 01 - 05 3. a. Analysis of how project profitability and NPV change if different assumptions are made about sales, cost, and other key variables b. Project NPV is recalculated by changing several inputs to new, but consistent, values. c. Determines the level of future sales at which project profitability or NPV equals zero. d. An extension of sensitivity analysis that explores all possible outcomes and weights each by its probability e. A graphical technique for displaying possible future events and decisions taken in response to those events f. Option to modify a project at a future date g. The additional present value created by the option to bail out of a project and recover part of the initial investment if the project performs poorly. h. The additional present value created by the option to invest more and 10-1 © 2014 by McGraw-Hill Education. This is proprietary material solely for authorized instructor use. Not authorized for sale or distribution in any manner. This document may not be copied, scanned, duplicated, forwarded, distributed, or posted on a website, in whole or part. Chapter 10 - Project Analysis expand output if a project performs well Est. Time: 06 - 10 4. a. False. Sensitivity analysis may show where additional information would be most useful. b. True c. True d. True e. False. A business with high fixed costs has high operating leverage. f. True Est. Time: 01 - 05 5. a. Describe how project cash flow depends on the underlying variables. b. Specify probability distributions for forecast errors for these cash flows. c. Draw from the probability distributions to simulate the cash flows. Est. Time: 01 - 05 6. a. True b. True c. False. Just as the option to expand has value, the option to terminate also raises the present value of the project. d. False. The optimal date to undertake an investment is the one that maximizes its contribution to the firm today. Est. Time: 01 - 05 7. Adding a fudge factor to the discount rate pushes project analysts to submit more optimistic forecasts. Est. Time: 01 - 05 9. a. 10-2 © 2014 by McGraw-Hill Education. This is proprietary material solely for authorized instructor use. Not authorized for sale or distribution in any manner. This document may not be copied, scanned, duplicated, forwarded, distributed, or posted on a website, in whole or part. Chapter 10 - Project Analysis NPVF $9,000 $6,000 (1 - 0.08) $5,000 (1 - 0.08) $4,000 (1 - 0.08) 1.10 (1.10) 2 (1.10) 3 = $2,584.67. NPVG $9,000 b. c. 12. $1,800 (1 - 0.08) $7,560. 0.10 $6,000 $5,000 $4,000 $2,110.19. 1.18 (1.18) 2 (1.18) 3 $1,800 NPVG $9,000 $1,000. 0.18 NPVF $9,000 The 18% discount rate would give an approximation to the correct NPVs for projects with all (or most) of the inflows in the first year. The present value of $1 to be received one year from now, discounted at 18% is: $0.8475. The present value of $1 × (1 – 0.08) (that is, $0.92) to be received one year from now, discounted at 10% is: $0.8364. The former calculation overstates the correct answer by approximately 1.3%. However, for cash flows five or ten years into the future, discounting by 18% understates the correct present value by approximately 23% and 46%, respectively. The error increases substantially because the incorrect factor (i.e., 1.18) is compounded, causing the denominator of the present value calculation to be greatly overstated so that the present value is greatly understated. a. Year 0 Investment 1. Revenue 2. Variable Cost 3. Fixed Cost 4. Depreciation 5. Pretax Profit (1 − 2 − 3 − 4) 6. Tax 7. Net Operating Profit (5 − 6) 8. Operating Cash Flow (4 + 7) Years 1–10 ¥30 B NPV = ¥37.500 B 26.000 3.000 3.000 ¥5.500 2.750 ¥2.750 5.750 + ¥5.33 B b. 10-3 © 2014 by McGraw-Hill Education. This is proprietary material solely for authorized instructor use. Not authorized for sale or distribution in any manner. This document may not be copied, scanned, duplicated, forwarded, distributed, or posted on a website, in whole or part. Chapter 10 - Project Analysis Unit Sales (000’s) 0 100 200 Inflows Revenues Investment Yrs 1–10 Yr 0 0.00 30.00 37.50 30.00 75.00 30.00 Outflows V. Costs F. Cost Yr 1–10 Yr 1–10 0.00 3.00 26.00 3.00 52.00 3.00 Taxes Yr 1–10 -3.00 2.75 8.50 PV Inflows 0.00 230.42 460.84 PV Outflows -30.00 -225.09 -420.18 NPV -30.00 5.33 40.66 Note that the break-even point can be found algebraically as follows: NPV = -investment + [(PVA10/10%) (t depreciation)] + [quantity (price – V. cost) – F. cost](1 – t)(PVA10/10%) Set NPV equal to zero and solve for Q: Q I (PVA 10/10% D t) F (PVA 10/10% ) (P V) (1 t) P V 30,000,000 ,000 9,216,850, 659 3,000,000, 000 6.144567 (375,000 260,000) 0.50 375,000 260,000 20,783,149 ,341 3,000,000, 000 58,824 26,087 84,911 353,313 115,000 Proof: 1. Revenue 2. Variable Cost 3. Fixed Cost 4. Depreciation 5. Pretax Profit 6. Tax 7. Net Profit 8. Operating Cash Flow NPV 10 t 1 ¥31.84 B 22.08 3.00 3.00 ¥3.76 B 1.88 ¥1.88 ¥4.88 4.88 30 29.99 30 0.01 (1.10) t (difference due to rounding) 10-4 © 2014 by McGraw-Hill Education. This is proprietary material solely for authorized instructor use. Not authorized for sale or distribution in any manner. This document may not be copied, scanned, duplicated, forwarded, distributed, or posted on a website, in whole or part. Chapter 10 - Project Analysis Break-Even PV (Billions of Yen) 500 450 400 350 300 250 200 150 100 50 0 PV Inflows PV Outflows Break-Even NPV = 0 0 100 200 Units (000's) c. The break-even point is the point where the present value of the cash flows, including the opportunity cost of capital, yields a zero NPV. d. To find the level of costs at which the project would earn zero profit, write the equation for net profit, set net profit equal to zero, and solve for variable costs: Net profit = (R – VC – FC - D) (1 – t) 0 = (37.5 – VC – 3.0 – 1.5) 0.50 VC = 33.0 This will yield zero profit. Next, find the level of costs at which the project would have zero NPV. Using the data in Table 11.1, the equivalent annual cash flow yielding a zero NPV would be: ¥15 B/PVA10/10% = ¥2.4412 B If we rewrite the cash flow equation and solve for the variable cost: NCF = [(R – VC – FC – D) (1 – t)] + D 2.4412 = [(37.5 – VC – 3.0 – 1.5) 0.50] + 1.5 VC = 31.12 This will yield NPV = 0, assuming the tax credits can be used elsewhere in the company. 10-5 © 2014 by McGraw-Hill Education. This is proprietary material solely for authorized instructor use. Not authorized for sale or distribution in any manner. This document may not be copied, scanned, duplicated, forwarded, distributed, or posted on a website, in whole or part. Chapter 10 - Project Analysis e. DOL = 1 + (fixed costs / profit). Fixed costs rise 1.5 due to additional depreciation of the 15 billion yen investment. Profits increase by 0.4 reflecting the lower variable costs. This gives us a DOL = 1 + ((3 + 1.5 + 1.5) / 3.4) = 2.76. 16. a. Operating leverage % change in operating income . % change in sales For a 1% increase in sales, from 100,000 units to 101,000 units: Operating leverage b. 0.075 / 3 2.50 0.375 / 37.5 Operating leverage 1 1 c. Operating leverage fixed cost depreciation operating profit (3.0 1.5) 2.5 3.0 % change in operating income . % change in sales For a 1% increase in sales, from 200,000 units to 202,000 units: Operating leverage (10.65 - 10.5)/10.5 1.43 (75.75 - 75) /75 10-6 © 2014 by McGraw-Hill Education. This is proprietary material solely for authorized instructor use. Not authorized for sale or distribution in any manner. This document may not be copied, scanned, duplicated, forwarded, distributed, or posted on a website, in whole or part.


