PFIZER INC. NYSE-PFE
TIMELINESS
SAFETY
TECHNICAL
–
1
–
Suspended 12/4/15
Raised 4/17/09
Suspended 12/4/15
BETA .85 (1.00 = Market)
High:
Low:
RECENT
PRICE
38.9
22.0
29.2
20.3
LEGENDS
11.0 x ″Cash Flow″ p sh
. . . . Relative Price Strength
Options: Yes
Shaded area indicates recession
28.6
22.2
27.7
22.2
24.4 RELATIVE
DIV’D
Median: 16.0) P/E RATIO 1.30 YLD 3.7%
32.42 P/ERATIO 23.2(Trailing:
24.2
14.3
19.0
11.6
20.4
14.0
21.9
16.6
26.1
20.8
32.5
25.3
33.1
27.5
36.5
28.5
VALUE
LINE
Target Price Range
2018 2019 2020
F
64
48
40
32
24
20
16
12
2018-20 PROJECTIONS
Ann’l Total
Price
Gain
Return
High
45 (+40%) 12%
Low
40 (+25%)
9%
Insider Decisions
F M
to Buy
0 0
Options 15 0
to Sell
3 3
A
0
0
0
M
0
0
1
J
0
2
2
J
0
0
1
A
0
0
0
S
0
0
0
O
0
0
0
8
6
% TOT. RETURN 11/15
Institutional Decisions
to Buy
to Sell
Hld’s(000)
1Q2015
828
888
4480705
2Q2015
772
903
4380147
3Q2015
842
819
4421403
Percent
shares
traded
18
12
6
1 yr.
3 yr.
5 yr.
1999 2000 2001 2002 2003 2004 2005 2006 2007 2008 2009 2010 2011 2012 2013 2014 2015 2016
4.21
4.68
5.14
5.25
5.92
7.03
6.97
6.79
7.16
7.16
6.20
8.46
8.90
8.11
1.02
1.18
1.50
1.72
2.21
2.84
2.80
2.85
3.03
1.94
1.66
2.09
2.34
2.35
.87
1.02
1.31
1.53
1.75
2.12
2.02
2.06
2.20
1.18
1.23
1.03
1.11
1.26
.31
.36
.44
.52
.60
.68
.76
.96
1.16
1.28
.80
.72
.80
.88
.41
.35
.35
.29
.35
.35
.29
.29
.28
.25
.15
.19
.22
.18
2.31
2.55
2.91
3.24
8.53
9.10
8.88
9.98
9.60
8.52 11.15 10.95 10.84 11.16
3847.0 6314.0 6277.0 6162.0 7629.0 7473.0 7361.0 7124.0 6761.0 6746.0 8070.0 8012.0 7575.0 7276.0
44.3
40.7
31.8
22.8
18.2
15.6
12.7
12.5
11.5
16.4
12.8
16.3
17.6
18.4
2.53
2.65
1.63
1.25
1.04
.82
.68
.67
.61
.99
.85
1.04
1.10
1.17
.8%
.9%
1.1%
1.5%
1.9%
2.1%
3.0%
3.7%
4.6%
6.6%
5.1%
4.3%
4.1%
3.8%
THIS
STOCK
VL ARITH.*
INDEX
8.7
44.9
140.7
-2.0
48.1
71.2
© VALUE LINE PUB. LLC
18-20
8.06
7.89
7.80
8.60 Sales per sh
10.00
2.77
2.32
2.35
2.70 ‘‘Cash Flow’’ per sh
3.55
A
G
1.65
1.41
1.40
1.70 Earnings per sh
2.50
.96
1.04
1.12
1.20 Div’ds Decl’d per sh B■
1.44
.19
.19
.20
.20 Cap’l Spending per sh
.20
11.92 11.33 11.30 11.80 Book Value per sh C
13.80
6399.0 6291.0 6200.00 6100.00 Common Shs Outst’g D 5800.00
17.6
21.5
24.0
Avg Ann’l P/E Ratio
17.0
.99
1.13
1.35
Relative P/E Ratio
1.05
3.3%
3.4%
3.3%
Avg Ann’l Div’d Yield
3.4%
51298 48371 48404 48296 50009 67809 67425 58986
47.4% 49.1% 47.8% 45.9% 46.2% 45.5% 48.6% 52.2%
5576.0 5293.0 5200.0 5090.0 4757.0 8487.0 9026.0 7611.0
15001 14984 15267 8026.0 8621.0 8266.0 8697.0 9490.0
22.5% 22.6% 21.0% 17.0% 20.3% 11.9% 31.5% 21.2%
29.2% 31.0% 31.5% 16.6% 17.2% 12.2% 12.9% 16.1%
13448 25560 25014 16067 24445 31859 29659 32796
6347.0 5546.0 7314.0 7963.0 43193 38410 34931 31036
65627 71358 65010 57556 90014 87813 82190 81260
21.1% 19.8% 21.4% 12.6%
6.8%
7.1%
8.0%
9.0%
22.9% 21.0% 23.5% 13.9%
9.6%
9.4% 10.6% 11.7%
14.4% 11.3% 11.2%
NMF
3.4%
2.5%
3.0%
3.6%
37%
46%
52% 106%
64%
74%
72%
69%
51584 49605
53.1% 46.5%
6410.0 5537.0
11341 9088.0
27.4% 25.5%
22.0% 18.3%
32878 36071
30462 31541
76307 71301
11.2%
9.4%
14.9% 12.7%
6.2%
3.5%
58%
73%
BUSINESS: Pfizer Inc. is a research-based, global biopharmaceutical company engaging in the discovery, development, manufacture,
and sale of healthcare products. Portfolio includes medicines, vaccines, and various consumer healthcare products. Manages operations through a structure consisting of three businesses: Global Innovative Pharmaceutical (GIP), Global Vaccines, Oncology, and
Consumer Healthare (VOC), and Global Established Pharmaceutical (GEP). Top-selling products ’14: Lyrica, Prevnar, Enbrel, and
Celebrex. Has 78,300 employees. Dirs/Off. own less than 1% of
common; BlackRock, 7.1%; Vanguard, 5.5% (3/15 proxy).
Chrmn/CEO: Ian C. Read. Inc.: Del. Addr.: 235 East 42nd St., New
York, NY 10017. Tel.: 212-733-2323. Internet: www.pfizer.com
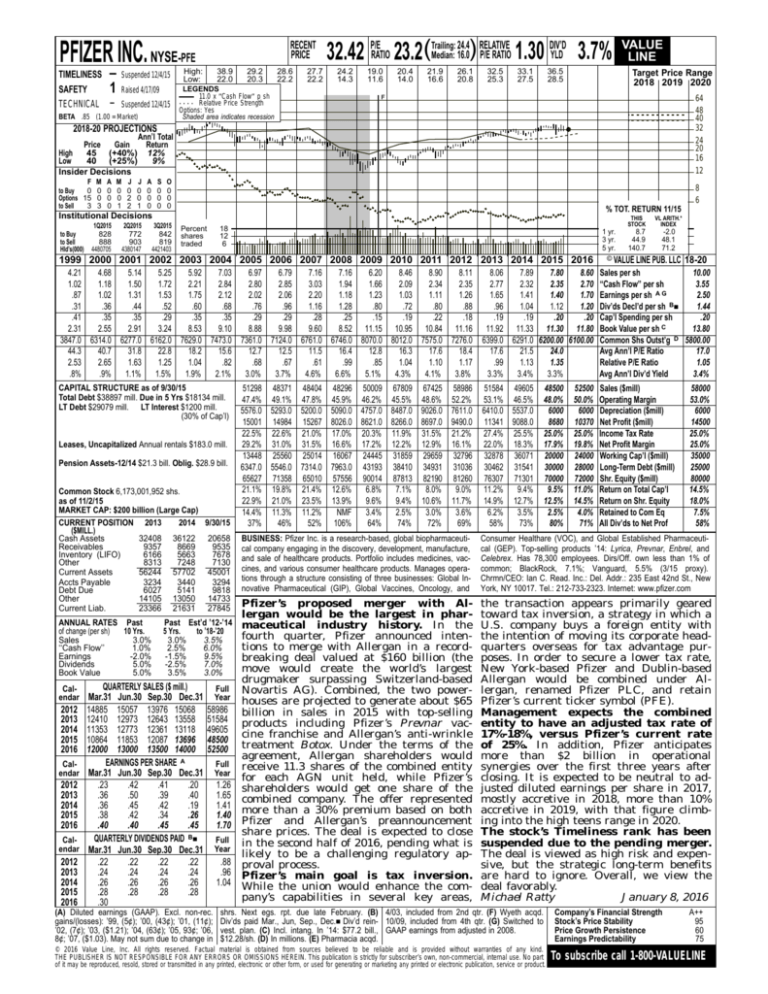
Pfizer’s proposed merger with Allergan would be the largest in pharANNUAL RATES Past
Past Est’d ’12-’14 maceutical industry history. In the
of change (per sh)
10 Yrs.
5 Yrs.
to ’18-’20
fourth quarter, Pfizer announced intenSales
3.0%
3.0%
3.5%
tions to merge with Allergan in a record‘‘Cash Flow’’
1.0%
2.5%
6.0%
Earnings
-2.0%
-1.5%
9.5%
breaking deal valued at $160 billion (the
Dividends
5.0%
-2.5%
7.0%
move would create the world’s largest
Book Value
5.0%
3.5%
3.0%
drugmaker surpassing Switzerland-based
QUARTERLY SALES ($ mill.)
CalFull Novartis AG). Combined, the two powerendar Mar.31 Jun.30 Sep.30 Dec.31 Year houses are projected to generate about $65
2012 14885 15057 13976 15068 58986 billion in sales in 2015 with top-selling
2013 12410 12973 12643 13558 51584 products including Pfizer’s Prevnar vac2014 11353 12773 12361 13118 49605 cine franchise and Allergan’s anti-wrinkle
2015 10864 11853 12087 13696 48500
2016 12000 13000 13500 14000 52500 treatment Botox. Under the terms of the
agreement, Allergan shareholders would
EARNINGS PER SHARE A
CalFull receive 11.3 shares of the combined entity
endar Mar.31 Jun.30 Sep.30 Dec.31 Year
for each AGN unit held, while Pfizer’s
2012
.23
.42
.41
.20
1.26 shareholders would get one share of the
2013
.36
.50
.39
.40
1.65 combined company. The offer represented
2014
.36
.45
.42
.19
1.41
2015
.38
.42
.34
.26
1.40 more than a 30% premium based on both
2016
.40
.40
.45
.45
1.70 Pfizer and Allergan’s preannouncement
share prices. The deal is expected to close
B■
QUARTERLY
DIVIDENDS
PAID
CalFull in the second half of 2016, pending what is
endar Mar.31 Jun.30 Sep.30 Dec.31 Year
likely to be a challenging regulatory ap2012
.22
.22
.22
.22
.88 proval process.
2013
.24
.24
.24
.24
.96 Pfizer’s main goal is tax inversion.
2014
.26
.26
.26
.26
1.04 While the union would enhance the com2015
.28
.28
.28
.28
pany’s capabilities in several key areas,
2016
.30
the transaction appears primarily geared
toward tax inversion, a strategy in which a
U.S. company buys a foreign entity with
the intention of moving its corporate headquarters overseas for tax advantage purposes. In order to secure a lower tax rate,
New York-based Pfizer and Dublin-based
Allergan would be combined under Allergan, renamed Pfizer PLC, and retain
Pfizer’s current ticker symbol (PFE).
Management expects the combined
entity to have an adjusted tax rate of
17%-18%, versus Pfizer’s current rate
of 25%. In addition, Pfizer anticipates
more than $2 billion in operational
synergies over the first three years after
closing. It is expected to be neutral to adjusted diluted earnings per share in 2017,
mostly accretive in 2018, more than 10%
accretive in 2019, with that figure climbing into the high teens range in 2020.
The stock’s Timeliness rank has been
suspended due to the pending merger.
The deal is viewed as high risk and expensive, but the strategic long-term benefits
are hard to ignore. Overall, we view the
deal favorably.
Michael Ratty
January 8, 2016
CAPITAL STRUCTURE as of 9/30/15
Total Debt $38897 mill. Due in 5 Yrs $18134 mill.
LT Debt $29079 mill. LT Interest $1200 mill.
(30% of Cap’l)
Leases, Uncapitalized Annual rentals $183.0 mill.
Pension Assets-12/14 $21.3 bill. Oblig. $28.9 bill.
Common Stock 6,173,001,952 shs.
as of 11/2/15
MARKET CAP: $200 billion (Large Cap)
CURRENT POSITION 2013
2014 9/30/15
($MILL.)
Cash Assets
32408 36122 20658
Receivables
9357
8669
9535
Inventory (LIFO)
6166
5663
7678
Other
8313
7248
7130
Current Assets
56244 57702 45001
Accts Payable
3234
3440
3294
Debt Due
6027
5141
9818
Other
14105 13050 14733
Current Liab.
23366 21631 27845
(A) Diluted earnings (GAAP). Excl. non-rec.
gains/(losses): ’99, (5¢); ’00, (43¢); ’01, (11¢);
’02, (7¢); ’03, ($1.21); ’04, (63¢); ’05, 93¢; ’06,
8¢; ’07, ($1.03). May not sum due to change in
48500
48.0%
6000
8680
25.0%
17.9%
20000
30000
70000
9.5%
12.5%
2.5%
80%
shrs. Next egs. rpt. due late February. (B) 4/03, included from 2nd qtr. (F) Wyeth acqd.
Div’ds paid Mar., Jun, Sep., Dec.■ Div’d rein- 10/09, included from 4th qtr. (G) Switched to
vest. plan. (C) Incl. intang. In ’14: $77.2 bill., GAAP earnings from adjusted in 2008.
$12.28/sh. (D) In millions. (E) Pharmacia acqd.
© 2016 Value Line, Inc. All rights reserved. Factual material is obtained from sources believed to be reliable and is provided without warranties of any kind.
THE PUBLISHER IS NOT RESPONSIBLE FOR ANY ERRORS OR OMISSIONS HEREIN. This publication is strictly for subscriber’s own, non-commercial, internal use. No part
of it may be reproduced, resold, stored or transmitted in any printed, electronic or other form, or used for generating or marketing any printed or electronic publication, service or product.
52500
50.0%
6000
10370
25.0%
19.8%
24000
28000
72000
11.0%
14.5%
4.0%
71%
Sales ($mill)
Operating Margin
Depreciation ($mill)
Net Profit ($mill)
Income Tax Rate
Net Profit Margin
Working Cap’l ($mill)
Long-Term Debt ($mill)
Shr. Equity ($mill)
Return on Total Cap’l
Return on Shr. Equity
Retained to Com Eq
All Div’ds to Net Prof
Company’s Financial Strength
Stock’s Price Stability
Price Growth Persistence
Earnings Predictability
58000
53.0%
6000
14500
25.0%
25.0%
35000
25000
80000
14.5%
18.0%
7.5%
58%
A++
95
60
75
To subscribe call 1-800-VALUELINE


