1.In its standardized form, the normal distribution a. has a mean of 0
advertisement
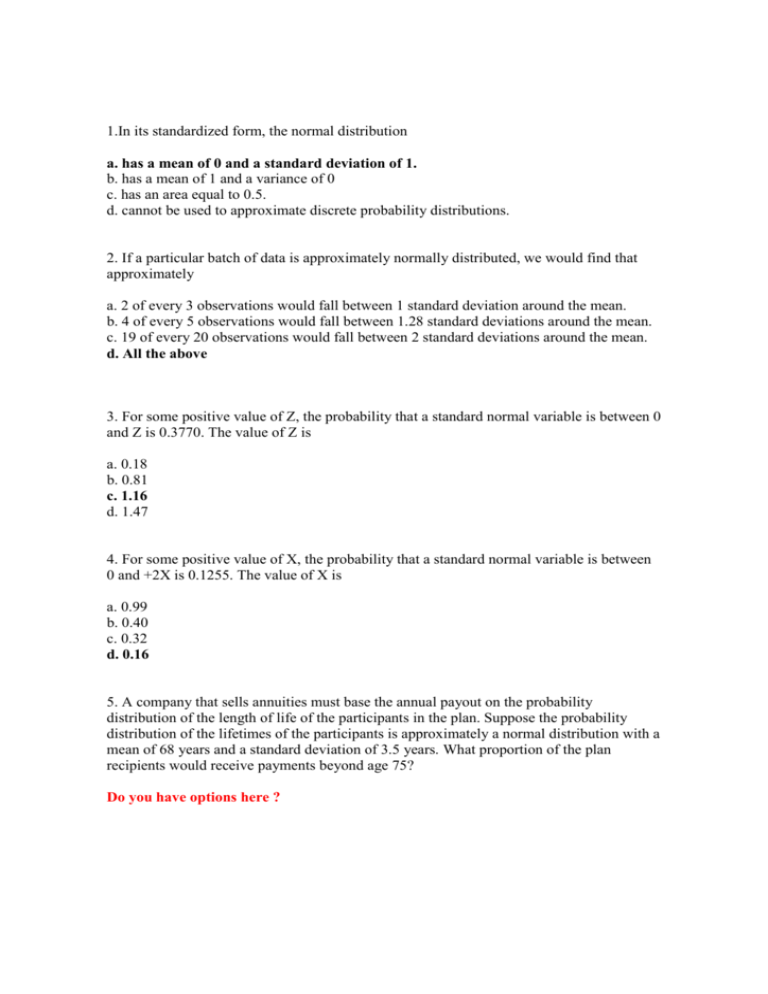
1.In its standardized form, the normal distribution a. has a mean of 0 and a standard deviation of 1. b. has a mean of 1 and a variance of 0 c. has an area equal to 0.5. d. cannot be used to approximate discrete probability distributions. 2. If a particular batch of data is approximately normally distributed, we would find that approximately a. 2 of every 3 observations would fall between 1 standard deviation around the mean. b. 4 of every 5 observations would fall between 1.28 standard deviations around the mean. c. 19 of every 20 observations would fall between 2 standard deviations around the mean. d. All the above 3. For some positive value of Z, the probability that a standard normal variable is between 0 and Z is 0.3770. The value of Z is a. 0.18 b. 0.81 c. 1.16 d. 1.47 4. For some positive value of X, the probability that a standard normal variable is between 0 and +2X is 0.1255. The value of X is a. 0.99 b. 0.40 c. 0.32 d. 0.16 5. A company that sells annuities must base the annual payout on the probability distribution of the length of life of the participants in the plan. Suppose the probability distribution of the lifetimes of the participants is approximately a normal distribution with a mean of 68 years and a standard deviation of 3.5 years. What proportion of the plan recipients would receive payments beyond age 75? Do you have options here ? 6. The standard error of the mean a. is never larger than the standard deviation of the population. b. decreases as the sample size increases. c. measures the variability of the mean from sample to sample. d. All of the above 7. If the expected value of a sample statistic is equal to the parameter it is estimating, then we call that sample statistic a. unbiased b. minimum variance. c. biased. d. random. 8. Sales prices of baseball cards from the 1960s are known to possess a skewed-right distribution with a mean sale price of $5.25 and a standard deviation of $2.80. Suppose a random sample of 100 cards from the 1960s is selected. Describe the sampling distribution for the sample mean sale price of the selected cards. a. Skewed-right with a mean of $5.25 and a standard error of $2.80 b. Normal with a mean of $5.25 and a standard error of $0.28 c. Skewed-right with a mean of $5.25 and a standard error of $0.28 d. Normal with a mean of $5.25 and a standard error of $2.80 9. The t distribution a. assumes the population is normally distributed. b. approaches the normal distribution as the sample size increases. c. has more area in the tails than does the normal distribution. d. All of the above. 10. A confidence interval was used to estimate the proportion of statistics students that are females. A random sample of 72 statistics students generated the following 90% confidence interval: (0.438, 0.642). Based on the interval above, is the population proportion of females equal to 0.60? a. No, and we are 90% sure of it. b. No. The proportion is 54.17%. c. Maybe. 0.60 is a believable value of the population proportion based on the information above. d. Yes, and we are 90% sure of it. 11. When determining the sample size necessary for estimating the true population mean, which factor is not considered when sampling with replacement? a. The population size. b. The population standard deviation. c. The level of confidence desired in the estimate. d. The allowable or tolerable sampling error. 12. Suppose a 95% confidence interval for turns out to be (1,000, 2,100). To make more useful inferences from the data, it is desired to reduce the width of the confidence interval. Which of the following will result in a reduced interval width? a. Increase the sample size. b. Increase the confidence level. c. Increase the population mean. d. Increase the sample mean. 13. In the construction of confidence intervals, if all other quantities are unchanged, an increase in the sample size will lead to a interval. a. narrower b. wider c. less significant d. biased 14. Which of the following would be an appropriate null hypothesis? a. The mean of a population is equal to 55 b. The mean of a sample is equal to 55. c. The mean of a population is greater than 55 d. Only (a) and (c) are true. 15. Which of the following would be an appropriate alternative hypothesis? a. The population proportion is less than 0.65. b. The sample proportion is less than 0.65. c. The population proportion is no less than 0.65. d. The sample proportion is no less than 0.65. 16. A Type II error is committed when a. we reject a null hypothesis that is true. b. we don't reject a null hypothesis that is true c. we reject a null hypothesis that is false. d. we don't reject a null hypothesis that is false. 17. A Type I error is committed when a. we reject a null hypothesis that is true. b. we don't reject a null hypothesis that is true. c. we reject a null hypothesis that is false. d. we don't reject a null hypothesis that is false. 18. The power of a test is measured by its capability of a. rejecting a null hypothesis that is true. b. not rejecting a null hypothesis that is true. c. rejecting a null hypothesis that is false. d. not rejecting a null hypothesis that is false. 19. If we are performing a two-tailed test of whether = 100, the probability of detecting a shift of the mean to 105 will be ________ the probability of detecting a shift of the mean to 110. Can you clarify this one ? a. less than b. greater than c. equal to d. not comparable to 20.If the Type I error ( a) for a given test is to be decreased, then for a fixed sample size n a. the Type II error (B ) will also decrease. b. the Type II error (B) will increase. c. the power of the test will increase. d. a one-tailed test must be utilized. 21. Given the following sample 1,2,3,4,5,6,20 a. Construct a 95% confidence interval for the population mean ( actual standard deviation not known use) Answer: (-0.123,11.837) b. Change the number 20 to 7 and recalculate the confidence interval. Answer: (2.002,5.998) c. Use the results to describe the effects of outlier on the confidence interval Answer: if we introduce an outlier the confidence interval is wider


