AP Statistics Midterm Practice Problems 2 Name
advertisement

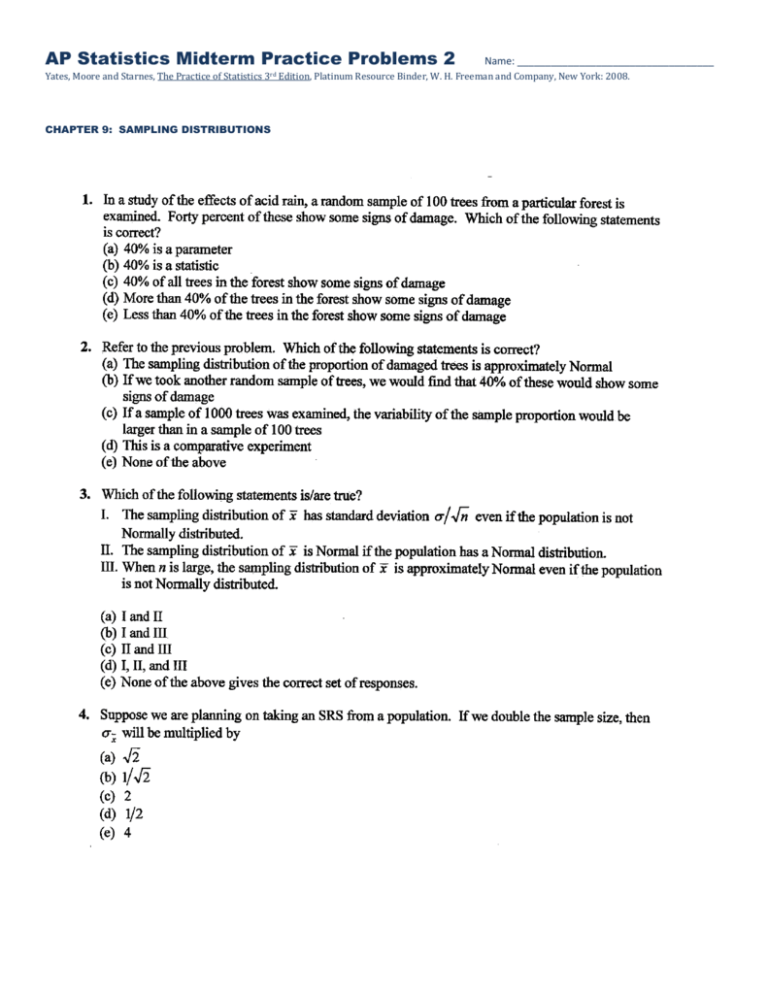
AP Statistics Midterm Practice Problems 2 Name: ___________________________________ Yates, Moore and Starnes, The Practice of Statistics 3rd Edition, Platinum Resource Binder, W. H. Freeman and Company, New York: 2008. CHAPTER 9: SAMPLING DISTRIBUTIONS CHAPTER 9: SAMPLING DISTRIBUTIONS CONTINUED CHAPTER 10: INTRODUCTION TO INFERENCE CHAPTER 10 CONTINUED 5. The time needed for college students to complete a certain paper-and-pencil maze follows a normal distribution with a mean of 30 seconds and a standard deviation of 3 seconds. You wish to see if the mean time is changed by vigorous exercise, so you have a group of nice college students exercise vigorously for 30 minutes and then complete the maze. You compute the average time X that it takes these students to complete the maze and test the hypothesis H o : 30, H a : 30 You find that the results are significant at the 5% level. You may also conclude (A) That the test would also be significant at the 10% level. (B) That the test would also be significant at the 1% level. (C) Both of the above (D) None of the above 6. In a test of statistical hypothesis, the P-value tells us (A) if the null hypothesis is true (B) if the alternative hypothesis is true (C) the largest level of significance at with the null hypothesis can be rejected (D) the smallest level of significance at with the null hypothesis can be rejected 7. The Survey of Study Habits and Attitudes (SSHA) is a psychological test that measures the motivation, attitude, and study habits of college students. Scores range from 0 to 200 and follow (approximately) a normal distribution with mean 115 and standard deviation 25. You suspect that incoming freshmen have a mean that is different than 115, since they are often excited yet anxious about entering college. To test your suspicion, you test the hypotheses H o : 115, H a : 115 You give the SSHA to 25 students who are incoming freshmen and find their mean score is 116.2. The P-value of your test is (A) 0.1151 (B) 0.2302 (C) 0.4052 (D) 0.8104 8. Is the mean height for all adult American males between the ages 19 and 21 now over 6 feet? If the population of all adult American males between the ages of 18 and 21 has mean height of feet and a standard deviation of feet, to answer this question one would test which of the following null and alternative hypotheses? (A) H o : 6, H a : 6 (B) H o : 6, H a : 6 (C) H o : 6, H a : 6 (D) H o : 6, H a : 6 x 9. The heights of young American women, in inches, are normally distributed with mean and standard deviation =2.4. If I want the margin of error for a 99% confidence interval to be 1inch, I should select a simple random sample of size (A) 2 (B) 7 (C) 16 (D) 39


