the press release here
advertisement
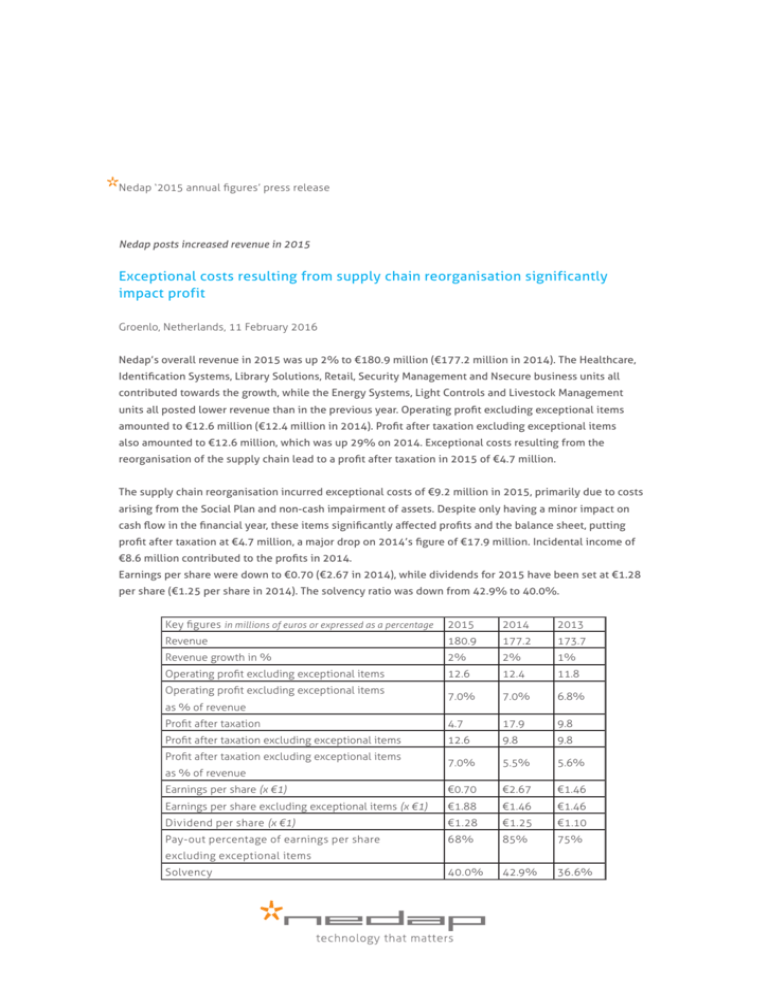
Nedap ‘2015 annual figures’ press release Nedap posts increased revenue in 2015 Exceptional costs resulting from supply chain reorganisation significantly impact profit Groenlo, Netherlands, 11 February 2016 Nedap’s overall revenue in 2015 was up 2% to €180.9 million (€177.2 million in 2014). The Healthcare, Identification Systems, Library Solutions, Retail, Security Management and Nsecure business units all contributed towards the growth, while the Energy Systems, Light Controls and Livestock Management units all posted lower revenue than in the previous year. Operating profit excluding exceptional items amounted to €12.6 million (€12.4 million in 2014). Profit after taxation excluding exceptional items also amounted to €12.6 million, which was up 29% on 2014. Exceptional costs resulting from the reorganisation of the supply chain lead to a profit after taxation in 2015 of €4.7 million. The supply chain reorganisation incurred exceptional costs of €9.2 million in 2015, primarily due to costs arising from the Social Plan and non-cash impairment of assets. Despite only having a minor impact on cash flow in the financial year, these items significantly affected profits and the balance sheet, putting profit after taxation at €4.7 million, a major drop on 2014’s figure of €17.9 million. Incidental income of €8.6 million contributed to the profits in 2014. Earnings per share were down to €0.70 (€2.67 in 2014), while dividends for 2015 have been set at €1.28 per share (€1.25 per share in 2014). The solvency ratio was down from 42.9% to 40.0%. Key figures in millions of euros or expressed as a percentage 2015 2014 2013 Revenue 180.9 177.2 173.7 Revenue growth in % 2% 2% 1% Operating profit excluding exceptional items 12.6 12.4 11.8 7.0% 7.0% 6.8% Profit after taxation 4.7 17.9 9.8 Profit after taxation excluding exceptional items 12.6 9.8 9.8 7.0% 5.5% 5.6% Earnings per share (x €1) €0.70 €2.67 €1.46 Earnings per share excluding exceptional items (x €1) €1.88 €1.46 €1.46 Dividend per share (x €1) €1.28 €1.25 €1.10 Pay-out percentage of earnings per share 68% 85% 75% 40.0% 42.9% 36.6% Operating profit excluding exceptional items as % of revenue Profit after taxation excluding exceptional items as % of revenue excluding exceptional items Solvency Press Release Developments in the various markets The European distributed electricity storage market showed limited growth in 2015, while more and more players launched energy storage solutions, leading to market fragmentation and increasingly competitive prices. As a result, the Energy Systems business unit (systems for the independent and effective generation, storage and consumption of electricity) posted reduced revenue in 2015. Sustainable energy production involves energy sources with a highly variable output, such as sun and wind. Balancing out the peaks and troughs with traditional sources such as coal and gas-fired power stations is very expensive. Local energy storage therefore has many benefits and is also becoming increasingly attractive in financial terms, given that the price of battery systems is dropping. Distributed energy storage services are thus expected to perform very well in the long term. However, the outlook for the next few years is less positive. The energy market is facing a complex system of legislation, regulations and subsidy programmes, while there is much uncertainty on the market due to the unpredictability of measures taken at various levels of government. This affects customers’ willingness to invest and the market’s development. Several major players have also announced their intention to enter the market, creating additional competition which, in addition to the expected increase in price erosion, will significantly impact on this market’s profit potential. Since this market will be of less commercial interest in the years to come, a decision was made at the end of 2015 to further downscale the business unit’s activities. Nedap will continue to meet maintenance and warranty obligations, but will not launch any new products for the time being. Several employees will be transferred to other business units over the course of 2016. If market conditions show a structural improvement, Nedap can consider expanding these activities again. In light of the market outlook and the decision to downscale activities, the business unit expects revenue in 2016 to be lower. The Healthcare business unit (automation of tasks for healthcare professionals) achieved a sound increase in revenue once again in 2015. It is very satisfactory to see healthcare institutions switching to the business unit’s software services even faster than before. Cutbacks in the healthcare sector have led to a reduction in the amount of healthcare indicated and supplied. This puts pressure on the income of healthcare institutions so they are constantly looking for ways to cut costs. For instance, more and more institutions are reducing the number of administrative systems they use and switching to a single system that provides end-to-end support for the entire healthcare process and reduces the complexity of administrative processes. Nedap is increasingly the partner of choice for such products. The business unit expects to increase its share in the elderly care market in 2016 and has already managed to win over the first customers on the adjacent mentally handicapped and mental healthcare markets with the strength of Nedap’s approach. The functionality of Nedap’s solutions will be expanded over the next few years in order to be able to support more work processes in this segment of the healthcare market. Since all three healthcare sectors have significant opportunities for growth, the business unit expects to be able to continue its increase in revenue. Growth on the temporary employment market has resulted in more timesheets being processed using Pep® (digitised timesheet processing and work schedules) and in increased revenue in 2015. This solution’s increasing number of users includes several temporary employment organisations who are opting to switch entirely to Pep, meaning that all of their timesheets are processed using this software service. 2 Since the Dutch labour market is becoming increasingly flexible, the need for Pep is growing, and this includes organisations hiring temporary staff. These organisations then ask their supplying agencies to also start using Pep. The increase in the number of organisations using Pep and the forecast growth in the number of hours worked through temporary employment agencies in the Netherlands will help this business unit to post even higher revenue. The Identification Systems business unit (vehicle and driver identification products and wireless parking systems) achieved a sound growth in revenue in 2015, with all four of the unit’s propositions — vehicle identification, people identification, vehicle detection and city access control — contributing towards the result. Growth was achieved in almost all regions all over the world, particularly in North America and the Middle East. The number of SENSIT projects sold increased once again in the 2015 financial year. By combining wireless sensors with software services, the business unit is able to give government and commercial organisations a clear, user-friendly picture of parking space usage. The business unit will continue to reinforce and expand its four propositions in 2016, with attractive product launches in the pipeline that will make its services even more relevant to customers. The balanced product portfolio, expanding partner network and increasing intensity of marketing activities should enable the unit to achieve further growth in revenue over the next few years. The Library Solutions business unit (RFID systems for libraries) is concentrating its efforts entirely on the development and supply of technical core components for ‘smart’ libraries. The global increase in the number of partners has convinced more and more libraries to adopt Nedap’s systems, enabling the unit to post higher revenue in 2015. The market for RFID systems for libraries is still developing steadily, with demand increasing on major markets like the United States, as well as in countries such as Spain and France. On the other hand, the number of companies developing technology especially for the library market is dropping each year, so system integrators are constantly looking for new technology providers. This presents commercial opportunities for Nedap. The business unit operates in more countries than before, following expansion of its partner network to South Africa, Vietnam, Hong Kong, Mexico and Canada. New partnerships have also been struck in Germany, the United States and Italy to name but a few, which has improved market coverage. The unit invested in reinforcing its product portfolio in 2015. Our partners are managing to land more and more contracts thanks to constant efforts to guarantee ease of integration and reduced complexity, and ensure our products remain solid. Since RFID technology is increasingly being used in libraries all over the world, demand for technological components is on the rise. More and more partners are switching to Nedap products every day, so the business unit expects to increase its revenue further over the next few years. The Light Controls business unit (power electronics and control systems for the lighting industry) has had a disappointing financial year. Almost all of its product lines faced difficulties, with overall revenue dropping as a result. The curing market (UV drying and hardening of industrial inks, coatings and adhesives) was negatively affected by a reluctance to invest in capital goods. Once the tide has turned and more investments are being made in curing equipment, the demand for Nedap UV lamp drivers is expected to grow again. 3 Press Release In 2015, revenue posted for UV lamp drivers for disinfection (treatment of water with intensive UV light) was up slightly on the previous year, while global investments in water treatment projects using UV light remained more or less unchanged. It still is difficult to predict when ballast water treatment will be a legal requirement and therefore boost demand for our lamp drivers. Falling oil prices have resulted in a large drop in investments in the offshore sector and oil-processing industry, causing a further reduction in sales of explosion-proof lighting. In light of oil price developments, revenue for this type of system will likely stay low in 2016. As expected, revenue for the QL portfolio (street lighting and other applications) dropped further in 2015. The business unit’s Luxon light management system is designed for lighting projects in high-ceilinged buildings, which generally use high-power fittings. Although this market previously mainly used High Intensity Discharge or HID lamps, LED lighting is now increasingly popular. Since the Luxon system was made compatible with LED technology, the number of projects combining the two has risen sharply. In light of the poor market outlook for HID technology, a decision was made at the end of 2015 to accelerate depreciation and amortisation of the investments made in development, production resources and inventories, while development capacity in the field has also been reduced. The associated exceptional costs are explained in more detail in the Financial highlights paragraph. Nedap sets itself apart from its competitors on the lighting market with a solid wireless control system and a light management system that packs plenty of functionality and is still user-friendly. The business unit therefore expects growth on this market. The unit’s overall revenue will grow in the years to come. Unfortunately, the Livestock Management business unit (automation of livestock management processes based on identification of individual animals) did not manage to maintain its increase in revenue over the financial year. The excellent growth on the pig farming market was not enough to compensate for decreasing revenue on the dairy market. As a result, the market group’s overall revenue was down on 2014. Geopolitical developments and economic stagnation caused flagging demand for dairy products. Together with an increase in milk production following the abolition of the European Union’s milk quota, this caused a sharp drop in milk prices. Sales channel expansion, especially on the genetics segment, has enabled Nedap to greatly increase its share in this market. This has enabled the business unit to largely compensate for the reluctance to invest in this sector. Investments in the product range have reinforced Nedap’s position on the pig farming market. Nedap not only provides solutions for feeding pregnant sows, but also for farrow feeding, weighing and sorting finishing pigs and monitoring the growth of individual animals. This means the business unit has more to offer its customers and the average revenue per project will therefore increase. Directly influenced by milk and meat prices, general investment levels in the cattle farming sector will continue to impact on the business unit. Increasing automation in the cattle farming industry will continue in the long term, so the business unit’s potential for growth will increase. Investments in the product groups and commercial strength are expected to enable the business unit to further expand its market share. Although short-term developments are impossible to predict, the business unit is hoping for a healthy increase in revenue in the long term. Despite challenging market conditions, the Retail business unit (security, management and information systems for the retail sector) increased its market share and revenue once again in 2015, which has not 4 gone unnoticed by our competitors. Major players are giving it their all, particularly in competing for large projects, and are not afraid to throw down the gauntlet when it comes to price. However, our continued investments in product improvement have not only enabled us to maintain our competitive total cost of ownership, but also to convince retailers that our systems will ultimately give them better results. The business unit reinforced its presence in North America in early 2015, opening a new sales office in Boston with its own commercial team. Since then, a great deal of work has been put into intensifying relationships with leading retailers. The unit expects to be able to launch the first large-scale projects at American retail chains in 2016, although it is hard to estimate the exact date. RFID technology will give fashion and other retailers better information on inventories at their various sites. This enables them to get the right items in the right place, ensuring customers can always find what they want and preventing unsold inventories. Pilot projects have demonstrated that Nedap’s RFID propositions significantly increase revenue and profits. However, experience has shown that the decision-making process is very lengthy when it comes to using RFID technology in a retail chain. If the RFID market grows, Nedap should be very capable of carving out a leading position for itself. The increasing number of commercial contacts with leading retailers confirms that the business unit’s propositions and commercial strength give it an outstanding starting position, so we expect revenue on the Retail market to increase over the next few years. In increasing its market share, the Security Management business unit (development and supply of top-quality access control, locker management, video surveillance, intrusion alarms and alarm response services using an open security platform) achieved an excellent growth in revenue in 2015. The business unit once again landed contracts with several leading organisations in 2015, thanks to its AEOS security platform. The launch of the AEOS Blue line has had a positive impact on our partners’ competitive position, with a significantly higher number of projects being landed, thanks to the competitive prices and major simplification of project design and system installation. The number of new partners embracing AEOS as standard has also increased, but this growth has only had a limited impact on the business unit’s revenue, due to long sales cycles. The European Security Management market will achieve limited growth over the next few years, but Nedap will strengthen its competitive advantage by constantly investing in technology, organisation and people. The business unit expects to expand its market share and increase its revenue in 2016. Full Nedap subsidiary Nsecure (development, implementation and maintenance of sustainable, userfriendly security solutions) posted increased revenue in 2015, landing a key contract from a major utility company during the financial year thanks to its sound deployment of people and technology. Innovative access control support services also boosted the growth in revenue. These services involve taking care of identity, permit and security certificate checks for major organisations as part of their safety and security policies in a largely automated process. In order to reinforce its market position, Nsecure has spent a lot of time professionalising internal and external automation processes, so as to deliver an even higher level of service. 2015 saw the subsidiary launch its ‘Control Your Access’ pay-off, which emphasised its focus on service-oriented and process-based access control. Nsecure expects its growth to continue over the next few years. 5 Press Release Major changes are being made to the production organisation and sites, following the decision to subcontract most production activities. Inventi will be closed in due course, while production and logistics activities will be downscaled in Groenlo. These measures will result in considerable exceptional costs, which are explained in more detail in the Financial highlights paragraph. However, we should be able to recoup these exceptional costs within a few years thanks to the lower costs of sales of our products. The main challenge for the next two years will be ensuring a smooth transfer of production processes to selected production partners, while still achieving problem-free delivery of current orders. Financial highlights Overall revenue in 2015 amounted to €180.9 million, which was up 2% on 2014 (€177.2 million). Revenue from services (subscriptions and maintenance contracts) rose by 20% to €28.3 million (€23.6 million in 2014) and accounted for 15.6% of the overall revenue (13.3% in 2014). Added value (revenue less cost of materials, plus or less inventory movements), expressed as a percentage of revenue, dropped from 70.0% in 2014 to 68.7%. An additional €1.3 million was spent on Subcontracting and other costs compared with 2014, and this increase is related to higher other employee costs. The number of employees increased by 4 over the financial year, to 765 at year end. On average, there were 6 more employees over the financial year than in 2014. Nedap received a one-off payment of €1.5 million in past overpaid premiums from its former pension provider, following the settlement of a pension plan that expired at the end of 2014. This amount has been incorporated in the social security costs, the percentage of which is therefore lower than in previous years. Depreciation and amortisation over the financial year amounted to €9.6 million, which is €1.0 million less than in 2014. Exceptional costs in 2015 amounted to €9.1 million, while the exceptional costs due to the supply chain reorganisation amounted to €9.2 million and are expected to be recouped in around two years. Following a revaluation of the provisions made for the Energy Systems business unit at the end of 2014, further downscaling of Energy Systems’ activities will result in exceptional income of €0.1 million. Of the total €9.1 million in exceptional costs, €7.5 million relates to Restructuring costs, €7.2 million of which is for employees. Impairment of assets amounted to €1.6 million in 2015 and is of a non-cash nature. Capitalisation of fixed assets manufactured in-house in 2015 was down €0.6 million on 2014, amounting to €0.4 million. This item mainly related to development projects. The overall costs of research and development amounted to €20.5 million (€21.4 million in 2014), €0.3 million of which has been capitalised (€1.1 million in 2014). Net financing costs dropped sharply by €0.3 million to €0.3 million, mainly due to improved interest rate conditions. 6 The 2015 tax rate amounted to -16.2% (21.1% in 2014), due to the combined impact of fiscal incentive schemes and offsettable losses. Nedap has negotiated advantageous conditions with the Dutch tax authorities to apply the Innovation Box tax regime in 2016 to 2019 inclusive. The aforementioned developments result in profit after taxation of €4.7 million (€17.9 million in 2014). Profits in 2014 were greatly influenced by exceptional income. Taking into account the exceptional costs of €9.1 million, profit after taxation in 2015 amounted to €12.6 million (€9.8 million in 2014), or 7.0% of revenue (5.5% in 2014). An investment of €6.5 million was made in tangible fixed assets during the financial year, while an amount of €8.2 million was depreciated and amortised on this item (€8.4 million in 2014). Impairment of €0.7 million was also applied (€1.2 million in 2014). Investment in intangible fixed assets amounted to €0.6 million in 2015, with depreciation and amortisation of €1.4 million and impairment of €0.4 million (€4.0 million in 2014). The inventory value increased by €1.3 million to €24.7 million, amounting to 13.7% of revenue at the end of the financial year (13.2% in 2014). At €31.1 million (€29.4 million in 2014), trade and other receivables were €1.7 million higher at the end of 2015, thanks to the increased revenue posted in the final weeks of the year. The average credit term of trade accounts receivable dropped from 7.4 weeks in 2014 to 7.3 in 2015. The 2015 balance sheet total dropped by €1.2 million to €110.9 million. Amounting to €4.7 million, profit after taxation in 2015 was greatly affected by exceptional items, which is why Nedap has decided to base the dividend payable for 2015 on the profit after taxation excluding exceptional items. An amount of €3.9 million will be withdrawn from the reserves as a result. The solvency ratio (shareholders’ equity excluding payable dividends and minority interest divided by the balance sheet total) has therefore dropped from 42.9% at the end of 2014 to 40.0% at the end of 2015. The solvency ratio is expected to increase gradually to the target of 45% over the coming years, partly because supply chain reorganisation will lead to a decrease in the balance sheet total. Cash flow from operating activities in the financial year was more than sufficient to cover investments in tangible and intangible fixed assets and the dividend for 2014. On balance, the bank debt rose by €1.3 million, which can be explained by the amount of €5.6 million received from the former pension provider in late 2014 being paid to pension participants in 2015, as expected. Only minor changes were made to Nedap’s financing facilities in 2015. The facilities have a flexible repayment scheme and take seasonal patterns into account. At the end of 2015, they amounted to €44.9 million (€45.6 million in 2014), of which €22.3 million is used. Cash and cash equivalents were €3.6 million as of 31 December 2015. 7 Press Release Nedap’s policy is to adequately mitigate risks that could arise in relation to financial instruments, and the company makes limited use of financial derivatives. Financial risk management and the risks are explained in the notes to the financial statements. For information on and notes to non-financial risks, please see the Corporate Governance section in the annual report. Outlook Nedap is all about moving markets with technology that matters. In recent years, we have constantly worked to gear our organisation towards the customer groups, products and activities for which we can really make a difference. Focusing our talents on this goal will increase our impact on our markets. The development and expansion of a leading market position is a lengthy process, and one that requires plenty of perseverance and drive. It is often impossible to predict when we will achieve commercial and financial success, but the robustness of our organisation will give us the patience we need to move markets. What is more, all of our business units can draw on the ample expertise in technology, markets and processes available throughout the organisation as a key tool in setting Nedap apart from other market players and maintaining a strong competitive position. Continuous investment in developing our propositions and commercial strength has enabled us to expand our position on the various markets and enter new ones. The supply chain reorganisation is executed with great care, so as to mitigate the associated risks, and this is asking a lot of our organisation and employees. The solid balance sheet and financial headroom give us a firm financial foundation. We are confident about the future and expect healthy long-term growth. On this basis, we expect a further increase in revenue in 2016, unforeseen circumstances notwithstanding. The 2015 annual report will be published on 16 February (after the close of trading) and will only be available in electronic format. The annual general meeting of shareholders will take placed at 11am on Thursday 31 March at Nedap’s site in Groenlo (Parallelweg 2). For more information, please contact: Eric Urff CFO +31 544 47 11 11 www.nedap.com Nedap develops and supplies smart technological solutions to relevant problems. Feeding a growing population, providing clean drinking water all over the world and creating smart sustainable energy networks are just some of the issues Nedap works on. The company’s focus is always maintained on relevant technology. N.V. Nederlandsche Apparatenfabriek “Nedap” was founded in 1929. It has been listed on the stock exchange since 1947 and has over 760 employees worldwide. 8 Consolidated balance sheet at 31 December (€ x 1,000) Assets Non-current assets Property, plant and equipment Intangible assets Investment in associate Loans Deferred tax assets 2015 42,430 4,665 3,681 63 215 45,219 5,805 3,152 154 177 51,054 Current assets Inventories 24,728 Corporate income tax receivable 390 Trade and other receivables 31,106 Cash and cash equivalents 3,638 54,507 23,437 973 29,444 3,768 59,862 57,622 110,916 112,129 Equity and liabilities Equity Share capital Statutory reserves Reserves 669 4,187 43,357 669 5,578 32,327 48,213 38,574 Undistributed profit attributable to shareholders 4,671 17,877 52,884 56,451 115 –19 145 4 96 149 52,980 Non-current liabilities Borrowings 14,458 Derivative financial instruments 142 Employee benefits 598 Provisions 6,219 Deferred tax liabilities 979 56,600 16,209 239 – – 1,874 Current liabilities Borrowings Derivative financial instruments Provisions Bank overdrafts Corporate income tax payable Taxes and social security charges Trade and other payables 22,396 18,322 1,751 31 2,150 6,125 74 2,854 22,555 181 – 2,191 4,830 407 3,213 26,385 35,540 37,207 Non-controlling interests Undistributed profit attributable to non-controlling interests 9 2014 Total liabilities 57,936 55,529 110,916 112,129 Press Release Consolidated income statement (€ x 1,000) 2015 2014 180,875 177,193 Revenue Cost of materials 55,459 Movement in inventories of finished goods and work in progress 1,101 Subcontracting and other costs 50,010 Salaries 44,571 Social security charges 7,983 Depreciation, amortisation and impairment 9,595 Impairment of assets 1,571 Restructuring costs 7,531 Incidental settlement pensions – Non-current assets manufactured in-house –436 52,903 310 48,758 43,288 9,963 10,557 7,164 1,422 –18,712 –1,033 Total operating expenses 177,385 154,620 Operating profit 3,490 22,573 Financing income Financing expenses Value movements in derivative financial instruments 41 –417 66 Net financing expenses –642 955 585 Profit before taxation Taxation 4,135 22,516 –517 4,635 Profit after taxation 4,652 17,881 Profit attributable to shareholders of Nedap N.V. Profit attributable to non-controlling interests 4,671 –19 17,877 4 Profit after taxation 4,652 17,881 Average number of shares in issue 6,692,920 6,692,920 Earnings per ordinary share (in €) Diluted earnings per ordinary share (in €) 0,70 0,70 2,67 2,67 Share of profit of associate (after taxation) 10 –310 45 –694 7 Consolidated statement of comprehensive income (€ x 1,000) 2015 Profit after taxation 2014 4,652 17,881 Other comprehensive income Items that may not be reclassified to profit or loss Revaluation of defined-benefit pension obligation – –7,644 Items that may be reclassified to profit or loss on subsequent recognition Exchange gains and losses 60 –50 Other comprehensive income for the period after taxation 60 Total comprehensive income for the period 4,712 10,187 Attributable to shareholders of Nedap N.V. Attributable to non-controlling interests 4,731 –19 10,183 4 Total comprehensive income 4,712 10,187 The annual figures are derived from the not yet adopted Financial Statements 2015. The Financial Statements will be presented for adoption to the General Meeting of Shareholders on March 31, 2015. The Financial Statement are not yet filed at the Trade Register Office. 11 –7,694 Press Release Consolidated cash flow statement (€ x 1,000) 2015 Cash flow from operating activities Profit after taxation 4,652 17,881 10,694 –135 –955 –92 310 –517 – 7.029 15,794 –156 –585 –243 642 4,635 –18,712 8,888 16.334 10,263 –1,653 –1,731 –359 –3,777 - 187 4,807 508 456 –193 1,430 31 –7.333 7,039 –430 32 –166 –703 61 –3,845 –564 –4,487 Net cash from operating activities 13,089 30,696 –6,518 –617 465 426 –7,078 –1,173 373 394 –6,244 Cash flow from financing activities Long-term borrowings drawn – Long-term borrowings repaid –181 Loans granted 91 Dividend paid to non-controlling interests – Dividend paid to shareholders of Nedap N.V. –8,366 Repurchase of shares (balance) 34 –7,484 –8,422 –7,422 Movements in cash and cash equivalents and banks –1,577 15,790 Cash and cash equivalents and banks at 1 January Exchange gains and losses on cash and cash equivalents and banks –1,062 152 –17,045 193 Cash and cash equivalents and banks at 31 December –2,487 –1,062 Adjustments for: Depreciation, amortisation and impairment Book profit on sale of property, plant and equipment Share of profit of associate Exchange gains and losses on participating interests Net financing expenses Corporate income taxes Incidental settlement pensions Non-cash items Movements Movements Movements Movements Movements Movements in in in in in in trade and other receivables inventories taxes and social security charges trade and other payables employee benefits provisions Interest paid Interest received Income tax paid Cash flow from investing activities Acquisitions of property, plant and equipment Acquisitions of intangible assets Proceeds from sale of property, plant and equipment Dividend received from associate 12 2014 – –218 97 – –7,362 61


