DISNEY (WALT) NYSE-DIS
TIMELINESS
SAFETY
TECHNICAL
2
1
1
High:
Low:
Lowered 12/25/15
RECENT
PRICE
28.4
20.9
30.0
22.9
34.9
23.8
36.8
30.7
19.6 RELATIVE
DIV’D
Median: 16.0) P/E RATIO 1.08 YLD 1.5%
96.27 P/ERATIO 18.2(Trailing:
35.0
18.6
32.8
15.1
38.0
28.7
44.3
28.2
53.4
37.9
76.5
50.2
95.9
69.9
122.1
90.0
Target Price Range
2018 2019 2020
LEGENDS
12.0 x ″Cash Flow″ p sh
. . . . Relative Price Strength
Options: Yes
Shaded area indicates recession
Raised 2/13/09
Raised 1/22/16
BETA 1.05 (1.00 = Market)
VALUE
LINE
200
160
2018-20 PROJECTIONS
100
80
60
50
40
30
Ann’l Total
Price
Gain
Return
High 130 (+35%)
9%
Low 105 (+10%)
4%
Insider Decisions
to Buy
Options
to Sell
M
0
3
4
A
0
0
0
M
0
2
2
J
0
3
4
J
0
1
2
A
0
2
1
S
0
0
0
O
0
9
0
N
0
0
0
20
% TOT. RETURN 12/15
Institutional Decisions
1Q2015
2Q2015
3Q2015
759
772
907
to Buy
to Sell
746
705
688
Hld’s(000)105885710570181020309
Percent
shares
traded
30
20
10
1 yr.
3 yr.
5 yr.
1999 2000 2001 2002 2003 2004 2005 2006 2007 2008 2009 2010 2011 2012 2013 2014 2015 2016
11.34 12.09 12.52 12.40 13.23 15.05 15.91 16.61 18.10 20.76 19.88 20.07 23.21 23.49
1.30
1.98
1.89
1.06
1.19
1.70
2.03
2.32
2.81
3.28
2.77
3.03
3.79
4.26
.66
.90
.98
.55
.66
1.09
1.31
1.61
1.92
2.26
1.82
2.07
2.54
3.13
.20
.21
.21
.21
.21
.21
.24
.27
.31
.35
.35
.35
.40
.60
1.03
1.02
.89
.53
.51
.70
.91
.63
.80
.87
.96
1.11
2.02
2.10
10.16 11.65 11.23 11.48 11.63 12.77 13.06 15.42 15.67 17.73 18.55 19.78 21.22 22.09
2064.0 2069.0 2019.0 2042.0 2045.0 2043.0 2007.2 2064.0 1962.2 1822.9 1818.3 1896.9 1762.2 1800.0
46.0
39.5
30.4
37.2
28.0
21.8
20.4
17.1
17.8
14.2
12.5
15.7
15.1
13.6
2.62
2.57
1.56
2.03
1.60
1.15
1.09
.92
.94
.85
.83
1.00
.95
.87
.7%
.6%
.7%
1.0%
1.1%
.9%
.9%
1.0%
.9%
1.1%
1.5%
1.1%
1.0%
1.4%
CAPITAL STRUCTURE as of 10/2/15
Total Debt $17336 mill. Due in 5 Yrs $10925 mill.
LT Debt $12773 mill. LT Interest $600 mill.
(Total interest coverage: NMF)
(22% of Cap’l)
Leases, Uncapitalized Annual rentals 4637 mill.
Pension Assets-10/15 $9.42 bill.
Oblig. $12.38 bill.
Pfd Stock None
Common Stock 1,653,177,887 shs.
as of 11/18/15
MARKET CAP: $159 billion (Large Cap)
CURRENT POSITION 2013
2014 10/2/15
($MILL.)
Cash Assets
3931
3421
4269
Receivables
6967
7822
8019
Inventory (Avg Cst) 1487
1574
1571
Other
1724
2359
2899
Current Assets
14109 15176 16758
Accts Payable
6803
7595
7844
Debt Due
1512
2164
4563
Other
3389
3533
3927
Current Liab.
11704 13292 16334
ANNUAL RATES Past
of change (per sh)
10 Yrs.
Revenues
7.0%
‘‘Cash Flow’’
13.5%
Earnings
15.0%
Dividends
18.0%
Book Value
8.0%
Fiscal
Year
Ends
2012
2013
2014
2015
2016
Fiscal
Year
Ends
2012
2013
2014
2015
2016
Calendar
2012
2013
2014
2015
2016
Past Est’d ’13-’15
5 Yrs.
to ’18-’20
7.5%
5.5%
13.5%
9.5%
15.5% 12.0%
26.5% 10.0%
7.0%
9.0%
QUARTERLY REVENUES ($ mill.) A
Dec.Per Mar.Per Jun.Per Sep.Per
10779 9629 11088 10782
11341 10554 11578 11568
12309 11649 12466 12389
13391 12461 13101 13512
14750 13390 13780 14100
EARNINGS PER SHARE A B
Dec.Per Mar.Per Jun.Per Sep.Per
.80
.63
1.01
.69
.77
.83
1.01
.77
1.03
1.08
1.28
.87
1.27
1.23
1.45
.95
1.45
1.40
1.50
1.15
QUARTERLY DIVIDENDS PAID C
Mar.Per Jun.Per Sep.Per Dec.Per
.60
--.75
----.86
---1.15
-.66
-.71
Full
Fiscal
Year
42278
45041
48813
52465
56020
Full
Fiscal
Year
(A) Fiscal year ends Saturday closest to Sept.
30th. Fiscal 2009 contained 53 weeks.
(B) Dil. egs. Excl. nonrecurring gains/(losses):
’99, (4¢); ’00, 2¢; ’01, ($1.00); ’02, 8¢; ’03, (4¢);
3.13
3.38
4.26
4.90
5.50
Full
Year
1.35
-.86
1.81
THIS
STOCK
VL ARITH.*
INDEX
12.9
119.0
200.1
-6.9
37.7
52.1
© VALUE LINE PUB. LLC
25.02 28.71 32.79 33.75 Revenues per sh A
4.63
5.76
6.71
6.95 ‘‘Cash Flow’’ per sh
3.38
4.26
4.90
5.50 Earnings per sh A B
.75
.86
1.81
1.42 Div’ds Decl’d per sh C
1.55
1.95
2.67
2.00 Cap’l Spending per sh
25.24 26.45 27.83 30.50 Book Value per sh D
1800.0 1700.0 1600.0 1660.0 Common Shs Outst’g E
17.1
18.6
20.9
Avg Ann’l P/E Ratio
.96
.98
1.06
Relative P/E Ratio
1.3%
1.1%
1.8%
Avg Ann’l Div’d Yield
Revenues ($mill) A
Operating Margin
Depreciation ($mill)
Net Profit ($mill)
Income Tax Rate
Net Profit Margin
Working Cap’l ($mill)
Long-Term Debt ($mill)
Shr. Equity ($mill)
Return on Total Cap’l
Return on Shr. Equity
Retained to Com Eq
All Div’ds to Net Prof
18-20
37.90
8.90
7.35
1.85
2.00
41.00
1675.0
16.0
1.00
1.6%
31944 34285 35510 37843 36149 38063 40893 42278
17.8% 20.2% 23.3% 23.7% 20.3% 22.2% 23.5% 25.7%
1339.0 1436.0 1491.0 1582.0 1631.0 1713.0 1841.0 1987.0
2729.0 3343.0 4014.0 4405.0 3408.0 4035.0 4839.0 5682.0
31.5% 34.2% 37.2% 36.6% 36.1% 35.1% 34.5% 33.3%
8.5%
9.8% 11.3% 11.6%
9.4% 10.6% 11.8% 13.4%
d323.0 d648.0 d77.0
75.0 2955.0 1225.0 1669.0 896.0
10157 10843 11892 11110 11495 10130 10922 10697
26210 31820 30753 32323 33734 37519 37385 39759
8.2%
8.4% 10.0% 10.8%
8.1%
8.9% 10.4% 11.6%
10.4% 10.5% 13.1% 13.6% 10.1% 10.8% 12.9% 14.3%
8.5%
8.9% 11.0% 11.6%
8.2%
9.0% 10.9% 11.6%
18%
16%
16%
15%
19%
16%
16%
19%
45041 48813 52465
25.8% 28.3% 29.7%
2192.0 2288.0 2354.0
6136.0 7501.0 8382.0
31.0% 34.6% 36.2%
13.6% 15.4% 16.0%
2405.0 1884.0 424.0
12776 12676 12773
45429 44958 44525
10.8% 13.0% 14.7%
13.5% 16.7% 18.8%
10.6% 13.3% 11.9%
22%
20%
37%
BUSINESS: The Walt Disney Company operates Media Networks,
incl. ABC and ESPN (44% of ’15 revs.); Parks and Resorts: Disneyland, Walt Disney World (Magic Kingdom, Epcot, Hollywood
Studios, Animal Kingdom), and a cruise line (31%); Studio Entertainment (14%); Consumer Products (9%); and Interactive Media
(2%). Earns Tokyo Disneyland royalties. Manages Disneyland Paris
and Hong Kong Disneyland. Acq. Pixar, 5/06; Marvel, 12/09; LucasFilms, 12/12. Div. ABC Radio, 6/07. ’15 depr. rate: 4.7%. Employs
185,000. Laurene Powell Jobs Trust owns 7.8% of stock; off. and
dir., less than 1% (1/16 proxy). Chairman/CEO: Robert A. Iger. Inc.:
DE. Address: 500 S. Buena Vista St., Burbank, CA 91521-7320.
Tel.: 818-560-1000. Internet: www.thewaltdisneycompany.com.
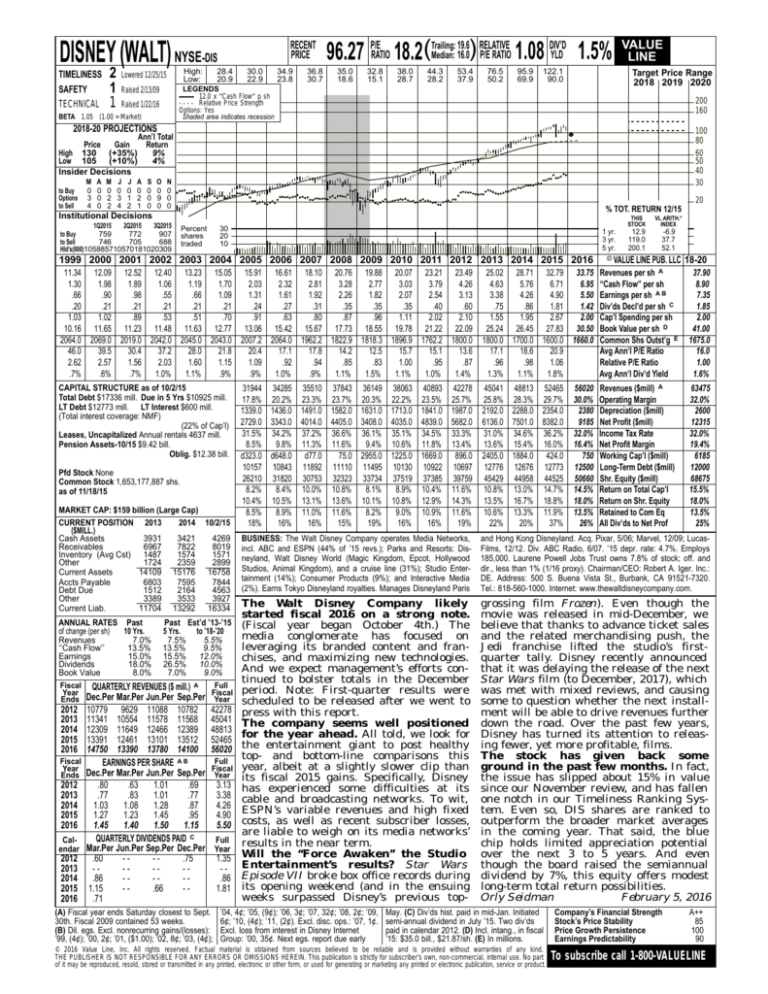
The Walt Disney Company likely
started fiscal 2016 on a strong note.
(Fiscal year began October 4th.) The
media conglomerate has focused on
leveraging its branded content and franchises, and maximizing new technologies.
And we expect management’s efforts continued to bolster totals in the December
period. Note: First-quarter results were
scheduled to be released after we went to
press with this report.
The company seems well positioned
for the year ahead. All told, we look for
the entertainment giant to post healthy
top- and bottom-line comparisons this
year, albeit at a slightly slower clip than
its fiscal 2015 gains. Specifically, Disney
has experienced some difficulties at its
cable and broadcasting networks. To wit,
ESPN’s variable revenues and high fixed
costs, as well as recent subscriber losses,
are liable to weigh on its media networks’
results in the near term.
Will the ‘‘Force Awaken’’ the Studio
Entertainment’s results? Star Wars
Episode VII broke box office records during
its opening weekend (and in the ensuing
weeks surpassed Disney’s previous top-
grossing film Frozen). Even though the
movie was released in mid-December, we
believe that thanks to advance ticket sales
and the related merchandising push, the
Jedi franchise lifted the studio’s firstquarter tally. Disney recently announced
that it was delaying the release of the next
Star Wars film (to December, 2017), which
was met with mixed reviews, and causing
some to question whether the next installment will be able to drive revenues further
down the road. Over the past few years,
Disney has turned its attention to releasing fewer, yet more profitable, films.
The stock has given back some
ground in the past few months. In fact,
the issue has slipped about 15% in value
since our November review, and has fallen
one notch in our Timeliness Ranking System. Even so, DIS shares are ranked to
outperform the broader market averages
in the coming year. That said, the blue
chip holds limited appreciation potential
over the next 3 to 5 years. And even
though the board raised the semiannual
dividend by 7%, this equity offers modest
long-term total return possibilities.
Orly Seidman
February 5, 2016
’04, 4¢; ’05, (9¢); ’06, 3¢; ’07, 32¢; ’08, 2¢; ’09,
6¢; ’10, (4¢); ’11, (2¢). Excl. disc. ops.: ’07, 1¢.
Excl. loss from interest in Disney Internet
Group: ’00, 35¢. Next egs. report due early
May. (C) Div’ds hist. paid in mid-Jan. Initiated
semi-annual dividend in July ’15. Two div’ds
paid in calendar 2012. (D) Incl. intang., in fiscal
’15: $35.0 bill., $21.87/sh. (E) In millions.
© 2016 Value Line, Inc. All rights reserved. Factual material is obtained from sources believed to be reliable and is provided without warranties of any kind.
THE PUBLISHER IS NOT RESPONSIBLE FOR ANY ERRORS OR OMISSIONS HEREIN. This publication is strictly for subscriber’s own, non-commercial, internal use. No part
of it may be reproduced, resold, stored or transmitted in any printed, electronic or other form, or used for generating or marketing any printed or electronic publication, service or product.
56020
30.0%
2380
9185
32.0%
16.4%
750
12500
50660
14.5%
18.0%
13.5%
26%
Company’s Financial Strength
Stock’s Price Stability
Price Growth Persistence
Earnings Predictability
63475
32.0%
2600
12315
32.0%
19.4%
6185
12000
68675
15.5%
18.0%
13.5%
25%
A++
85
100
90
To subscribe call 1-800-VALUELINE


