Microsoft PowerPoint - Lec. 06 Fuel
advertisement
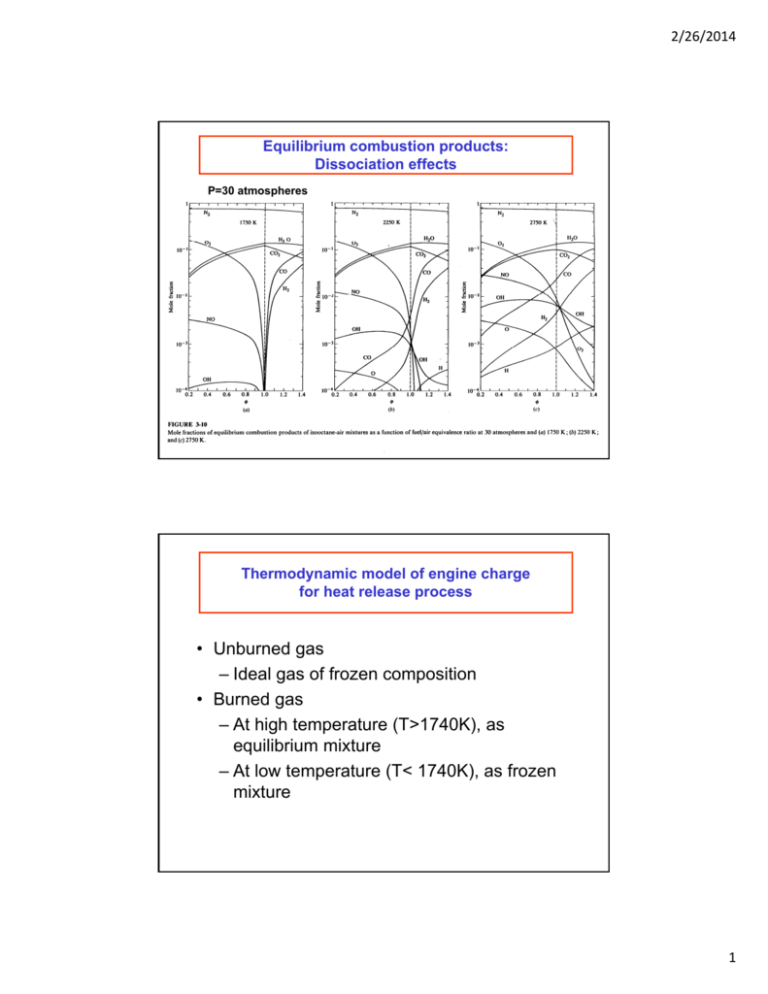
2/26/2014 Equilibrium combustion products: Dissociation effects P=30 atmospheres Thermodynamic model of engine charge for heat release process • Unburned gas – Ideal gas of frozen composition • Burned gas – At high temperature (T>1740K), as equilibrium mixture – At low temperature (T< 1740K), as frozen mixture 1 2/26/2014 Unburned gas properties for gasoline (CH1.85)/air 1.36 45 = 0.8 1.0 1.2 1.32 gamma cp or cv (J/mole-K) 40 1.34 cp 35 1.3 1.28 cv 30 1.26 = 0.8 1.0 1.2 25 1.24 20 300 400 500 600 700 800 900 1000 1100 1200 =0.8 1.0 1.2 1.22 300 400 500 600 700 800 900 1000 1100 1200 T(K) T(K) Burned gas properties for gasoline (CH1.85)/air 1.4 = 0.8 1.0 1.2 40 cp 35 cv = 0.8 1.0 1.2 30 200 400 600 1.3 =0.8 1.0 1.2 1.25200 400 600 800 1000 1200 1400 1600 1800 T(K) 25 20 1.35 gamma cp or cv (J/mole-K) 45 800 1000 1200 1400 1600 1800 T(K) Composition frozen at 1740K 2 2/26/2014 Fuel-air cycle results In the Fuel-Air Cycle, the engine processes are still modeled as ideal but the properties of the working fluid (fuel/air/residual gas mixture before combustion, and burned gases in chemical equilibrium after combustion) are described accurately. The results from this improved cycle analysis model are useful for estimating, approximately, the effects of compression ratio, fuel/air equivalence ratio, and mixture inlet conditions on engine efficiency and performance. The following approximate relationships are useful. 1. The maximum indicated fuel conversion efficiency of an actual engine is about 0.85 times the efficiency of the equivalent fuel-air cycle. 2. Results from change of engine operating condition can be interpreted in terms of percentage change in output values Computer codes which accurately simulate the real engine cycle have now been developed and are widely used. Fuel-air cycle results: f,i Fuel: octene; p1 = 1 atm, T1=388 K, xr=0.05 (Fig. 5.9) C B A A=SI engine at stoichiometric with rc=10; C=Diesel at A/F=36 (=0.4) with rc=15 3 2/26/2014 Real Cycle Effects 1. Combustion efficiency c 1 exhaust chemical energy as CO, H2, HC, soot 2. Heat loss, finite combustion time, actual valve timing chemcial energy in inducted fuel SI engine: H2 and CO ~ 1 to 2% of fuel energy HC ~ 1% of fuel energy c ~ 97-98% Diesel engine Very little unburned gas c ~ 99% Fig. 5-18 Pressure-volume diagram for actual SI engine compared with that for equivalent fuelair cycle; rc = 11. Deconstruction of cycle losses SAE 2009-01-1907 4
