Dabur India Ltd.
advertisement
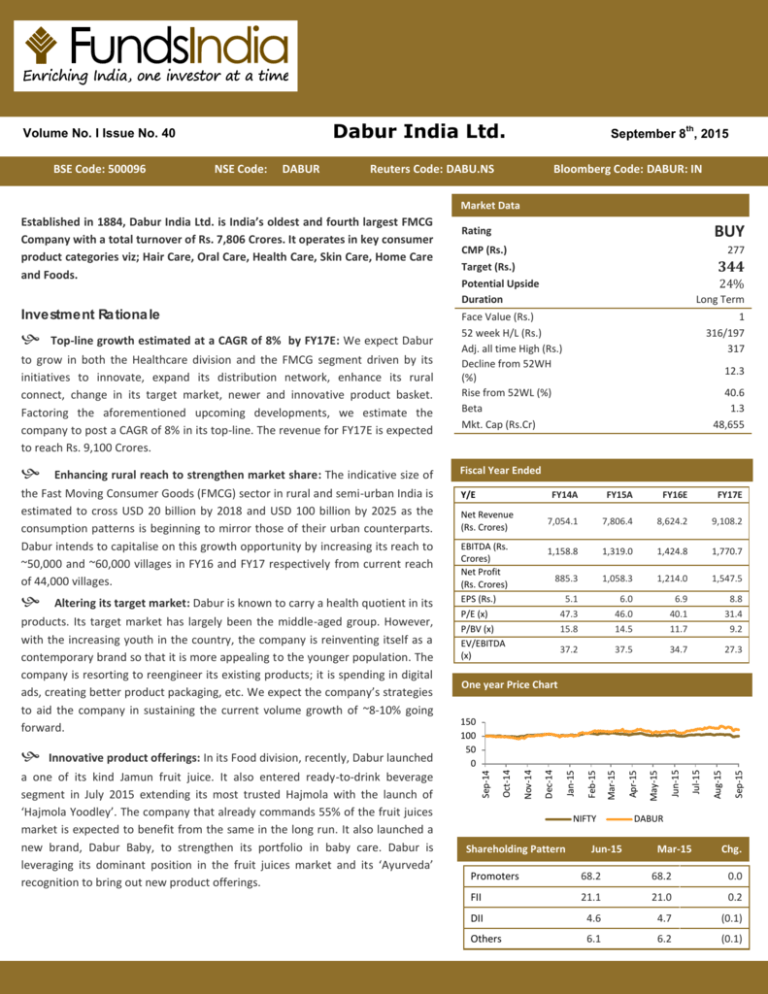
. Dabur India Ltd. Volume No.. I Issue No. 40 BSE Code: 500096 . NSE Code: DABUR th September 8 , 2015 Reuters Code: DABU.NS Bloomberg Code: DABUR: IN Market Data a one of its kind Jamun fruit juice. It also entered ready-to-drink beverage segment in July 2015 extending its most trusted Hajmola with the launch of ‘Hajmola Yoodley’. The company that already commands 55% of the fruit juices market is expected to benefit from the same in the long run. It also launched a new brand, Dabur Baby, to strengthen its portfolio in baby care. Dabur is leveraging its dominant position in the fruit juices market and its ‘Ayurveda’ recognition to bring out new product offerings. FY16E FY17E 7,054.1 7,806.4 8,624.2 9,108.2 1,158.8 1,319.0 1,424.8 1,770.7 885.3 1,058.3 1,214.0 1,547.5 5.1 6.0 6.9 8.8 P/E (x) 47.3 46.0 40.1 31.4 P/BV (x) EV/EBITDA (x) 15.8 14.5 11.7 9.2 37.2 37.5 34.7 27.3 One year Price Chart 150 100 50 0 NIFTY Shareholding Pattern Jun-15 Sep-15 Innovative product offerings: In its Food division, recently, Dabur launched EBITDA (Rs. Crores) Net Profit (Rs. Crores) EPS (Rs.) FY15A Aug-15 Net Revenue (Rs. Crores) FY14A Jul-15 products. Its target market has largely been the middle-aged group. However, with the increasing youth in the country, the company is reinventing itself as a contemporary brand so that it is more appealing to the younger population. The company is resorting to reengineer its existing products; it is spending in digital ads, creating better product packaging, etc. We expect the company’s strategies to aid the company in sustaining the current volume growth of ~8-10% going forward. Y/E Jun-15 Altering its target market: Dabur is known to carry a health quotient in its Fiscal Year Ended May-15 40.6 1.3 48,655 Apr-15 the Fast Moving Consumer Goods (FMCG) sector in rural and semi-urban India is estimated to cross USD 20 billion by 2018 and USD 100 billion by 2025 as the consumption patterns is beginning to mirror those of their urban counterparts. Dabur intends to capitalise on this growth opportunity by increasing its reach to ~50,000 and ~60,000 villages in FY16 and FY17 respectively from current reach of 44,000 villages. 12.3 Mar-15 Enhancing rural reach to strengthen market share: The indicative size of 1 316/197 317 Feb-15 24% Long Term Jan-15 to grow in both the Healthcare division and the FMCG segment driven by its initiatives to innovate, expand its distribution network, enhance its rural connect, change in its target market, newer and innovative product basket. Factoring the aforementioned upcoming developments, we estimate the company to post a CAGR of 8% in its top-line. The revenue for FY17E is expected to reach Rs. 9,100 Crores. 344 Dec-14 Top-line growth estimated at a CAGR of 8% by FY17E: We expect Dabur 277 Face Value (Rs.) 52 week H/L (Rs.) Adj. all time High (Rs.) Decline from 52WH (%) Rise from 52WL (%) Beta Mkt. Cap (Rs.Cr) Nov-14 CMP (Rs.) Target (Rs.) Potential Upside Duration Oct-14 Investment Ra tiona le BUY Rating Sep-14 Established in 1884, Dabur India Ltd. is India’s oldest and fourth largest FMCG Company with a total turnover of Rs. 7,806 Crores. It operates in key consumer product categories viz; Hair Care, Oral Care, Health Care, Skin Care, Home Care and Foods. DABUR Mar-15 Chg. Promoters 68.2 68.2 0.0 FII 21.1 21.0 0.2 DII 4.6 4.7 (0.1) Others 6.1 6.2 (0.1) Da bur India Ltd. Its marquee brands – Vatika, Real and Amla –crossed the Rs. 10,000 mn (USD 152 mn) sales mark globally in FY15. It has reported healthy returns consistently over the last 5 years despite difficult external environment across many of its markets. The sales have increased at a CAGR of ~14% from FY10 to FY15 and the PAT has also increased at a CAGR of ~13% during the same period. The company is now focusing on the next phase of expansion. Rs. Crores Net revenue growth in the coming years 10,000.0 9,000.0 8,000.0 7,000.0 6,000.0 5,000.0 4,000.0 3,000.0 2,000.0 1,000.0 0.0 9,108.2 8,624.2 7,806.4 7,054.1 FY14A FY15A FY16E FY17E Given the immense potential in rural markets going forward, the company has increased its rural coverage from 14,000 villages to around 44,000 villages over the last 3 years as a part of Project Double. It is now looking to expand its rural footprint to over 60,000 high potential villages over the next 2-3 years. The year 2014-15 saw Dabur surpassing many new landmarks. Dabur closed FY15 with a net profit in excess of Rs. 10,000 mn (USD 152 mn). The company also witnessed ramp up of the existing product portfolio and also launched many new products across the entire spectrum, from hair care to skin care and health supplements to digestives. 14.9 1,500 14.6 13.6 12.6 322 2,064 285 1,945 283 346 2,074 352 287 351 211 1,864 1,924 11.3 268 500 15.6 14.4 2,000 1,000 17.8 17.0 261 18.2 2,500 0 Q1FY15 Q2FY15 Q3FY15 Revenue EBITDA PAT Q4FY15 EBITDA Margin 20.0 18.0 16.0 14.0 12.0 10.0 8.0 6.0 4.0 2.0 0.0 Q1FY16 PAT Margin % Quarterly performance Rs. Crores Established in 1884, Dabur India Ltd. is India’s oldest and fourth largest FMCG Company with a total turnover of Rs. 7,827 Crores. Established in 1884, Dabur India Ltd. is India’s oldest and fourth largest FMCG Company with a total turnover of ~Rs. 7,800 Crores. It operates in key consumer products categories viz; Hair Care, Oral Care, Health Care, Skin Care, Home Care and Foods. The company has a wide distribution network, covering over 5.8 million retail outlets with a high penetration in both urban and rural markets. Its products also have a huge presence in the overseas markets and are today available in over 60 countries across the globe. Its brands are highly popular in the Middle East, SAARC countries, Africa, US, Europe and Russia. Dabur's overseas revenue currently accounts for over 30% of the total turnover. Showca ses impressive performa nce in Q1FY16 Led by an 11.6% and 9.2% growth in the domestic and international business, Dabur posted a top-line growth of 10.7% YoY. The top-line stood at Rs. 2,064 Crores as compared to Rs. 1,864 Crores. Led by an 11.6% and 9.2% growth in the domestic and international business, Dabur posted a top-line growth of 10.7% YoY. The top-line stood at Rs. 2,064 Crores as compared to Rs. 1,864 Crores. Toothpaste division recorded the highest growth of 24% owing to a 19% YoY increase in the volumes and strong product efficacy as the management’s strategy to affect brand switch is working well for the brand. OTC and Ethicals segment (up 17%) seems to be benefitting from management plans to increase focus on OTC and Ethicals and initiated ‘Project Lead’ which will help separate sales and distribution functions of OTC & Ethicals from the rest of its domestic FMCG businesses. Foods division continued to maintain double-digit growth momentum of ~15% led by ‘Real’ and ‘Homemade’ products. Dabur’s International business registered a growth of 9.2% during Q1FY16. Its Organic segment grew only by 10.3% as compared to a 16.5% growth in Q4FY15, impacted by political disturbances in the MENA region and currency devaluation in Nigeria and Egypt. While, Namaste business posted a recovery in growth in this quarter. On the EBITDA front, a 20% YoY growth was witnessed owing to declining material and ad spend as a percentage of net sales. The EBITDA stood at Rs. 322 Crores in Q1FY16. The EBITDA margin saw an expansion of 121 bps reported at 15.6%. The company was able to register a 23.9% growth in the bottom-line to Rs. 261 Crores aided by higher other income (up by 33%) and EBITDA growth. PAT margin stood at 12.6% reporting an expansion of 134 bps. FY15 performa nce During FY15, Dabur recorded consolidated net sales of Rs. 7,806 Crores growing by 10.7% During FY15, Dabur recorded consolidated sales of Rs. 7,806 Crores growing by 10.7%. The domestic FMCG business reported growth of 12.5% on the back of good volumes across categories and markets. The business witnessed a gentle cost environment in the second half of the year due to a steep correction in crude oil prices and also reduced inflation in the agri basket. This led to an improvement in the gross margins primarily in the second half of FY15. Material cost as a percentage of sales went down from 48.2% in FY14 to 47.7% in FY15. The company continued to invest behind the brands strongly as this fiscal year witnessed launch of many new products as well as a ramp up of the existing portfolio. This was reflected in the sustained Advertisement & Publicity expenditure at 14.4% of sales in FY15 as compared to 14.2% in FY14. Consequently, the EBITDA margin improved to 16.7% as compared to 16.0% in FY14. The Effective Tax Rate on a consolidated basis remained stable at 19% in FY15 and Profit after Tax (PAT) grew by 19.5% to Rs. 1,058.3 Crores in FY15. Internationa l business growth rema ins favoura ble International business includes Dabur’s organic overseas business as well as the acquired entities of Hobi Group and Namaste Laboratories LLC. This vertical account for 31% of Dabur’s consolidated sales. It has grown at an average rate of 7% in the sales over FY12-FY15. In FY15, the pace of new launches in the international space was kept up with the introduction of six new products. In Q1FY16, the international segment reported a growth of 9% YoY driven by growth across geographies viz; Bangladesh, GCC, Nepal and Turkey up by 7%, 10%, 15% and 22% respectively over the quarter. The organic segment grew by 10.3%, while, its Namaste business in North America posted a recovery and grew by 20%. With continuous innovation in the international markets in segments like Baby care, Hair Care and Skin care and pricing issues of Namaste products being resolved we expect the performance of this sector to improve in the coming years. For private circulation only Da bur: A 130 yea rs ‘young’ bra nd Dabur is bracing itself to make it appealing to the youth. We expect that the reinvention backed by innovative methodologies and strategic positioning will aid the consumer care business growth. Dabur is bracing itself to make it appealing to the youth. The company has emerged as an advocate of healthy living targets mostly the middle-aged population despite the fact that 70% of the Indian population is young. However, the company is channeling its product portfolio and its brand campaign towards more contemporary and vibrant. It has a three pillar strategy of going forward; viz, being young, vibrant and socially conscious. For instance, Dabur's air freshener product is being reengineered as an Aircare brand that spreads health through germ-killing. Dabur’s Chyawanprash is being considered in different formats that can appeal to young consumers: a candy, bar, tablets or biscuits. Besides, Dabur is also working to improve its brand image by utilizing the digital platform as was evident from its recent ‘Brave & Beautiful’ campaign. The company is going to increase its digital ad spends by at least 10% next year and to understand its target market better the company is undertaking live projects interaction with students on campuses. The company is also looking to alter its packing format to more sharper and premium appearance. Meanwhile the company also intends to improve its rural reach in order to capitalise on the rural growth. We expect that the reinvention backed by innovative methodologies and strategic positioning will aid the consumer care business growth. We expect the revenue from this segment to grow at a CAGR of 8% by FY17E. Project LEAD to lea d the wa y forwa rd An initiative focused towards creating a separate front end team for Healthcare (OTC & Ethicals portfolio) and FMCG, ‘Project LEAD’ is expected to enhance the healthcare division of the company. Dabur has initiated a new project termed “Project LEAD”, that is an abbreviation for Leveraging through Empowered Anchoring & Detailing. An initiative focused towards creating a separate front end team for Healthcare (OTC & Ethicals portfolio) and FMCG, it is expected to enhance the healthcare division of the company. It is aimed at increasing reach to doctors (Ayurvedic and Allopathic), build detailing team i.e. about 170 medical representatives (MRs) hired, which will be beefed upto 275 by FY16. The company has invested in technology and infrastructure by providing hand held devices to MRs for seamless information flow. This is expected to expand the healthcare portfolio which is witnessing a fast paced growth. Enha ncing the rura l connect We are optimistic about the company’s stronger foothold in the rural areas as the management is looking forward to increasing its reach to ~50,000 and ~60,000 villages in FY16 and FY17 respectively. During the past years, Dabur India Ltd. has tripled its rural penetration from ~18,000 villages in FY12 to ~44,000 villages in FY15. As a result, the revenue contribution from the rural areas has increased from 30% earlier to 45% adding a consistent volume growth of 8-10% over last 3 years. We are optimistic about the company’s growth as the management is looking forward to increasing its reach to ~50,000 and ~60,000 villages in FY16 and FY17 respectively. Project Double: Direct Village Coverage 50,000 44,128 38,250 40,000 30,091 30,000 20,000 14,865 17,882 10,000 0 FY11 FY12 FY13 FY14 FY15 The Fast Moving Consumer Goods (FMCG) sector in rural and semi-urban India is estimated to cross USD 20 billion by 2018 and USD 100 billion by 2025 as the consumption patterns in these areas are also gradually beginning to mirror those of their urban counterparts. Moreover, with the government’s initiative of prioritizing of financial inclusion, rural per capita consumption is expected to get a push. The company is planning to increase its healthcare offerings; it is aiming to increase its semi-urban coverage by capturing the untapped chemist network through a new initiative called ‘Project CORE’. It has increased its chemist network reach from ~31,000 (FY13) to ~75,000 in FY15. The company has also started building a team of medical representatives (hiring 170 people) for detailing, marketing its OTC & ethical products to reach Ayurvedic & allopathic doctors. Going forward, the company might experience some pressure in Q2FY16 on the top-line arising from subdued rural demand. However, the demand is expected to pick up from Q3FY16. Hence, we expect the top-line to cross Rs. 8,500 Crores mark by FY16E. Innova tive product offerings to fortify bra nd positioning Dabur is leveraging its dominant position in the fruit juices market and its ‘Ayurveda’ recognition to bring out new product offerings. In its Food division, Dabur launched one of its kind Jamun fruit juice. It also entered readyto-drink beverage segment in July 2015 and extending its most trusted Hajmola with the launch of ‘Hajmola Yoodley’. The company that already commands 55% of the fruit juices market in India is expected to benefit from the same in the long run. The company is also keen on extending its baby care product portfolio which as of now constitutes just three products contributes merely 1.6% to the top-line. It recently launched a new brand, Dabur Baby, as a way to strengthen its baby care portfolio. Products derived from natural oils will be among the offerings. The company is leveraging its robust ‘Ayurveda’ brand recognition, by offering products free from paraffin [a mixture of hydrocarbons], paraben [a preservative] and artificial colors. This bodes well for the company. RoE & RoCE to improve going further 38.0 37.0 36.0 35.0 34.0 33.0 32.0 31.0 30.0 29.0 37.3 35.1 36.3 35.2 35.6 34.1 32.3 FY14A FY15A FY16E RoCE 32.8 FY17E RoE Key risks International expansion and overseas raw material sourcing, is making Dabur increasingly susceptible to country risk and global currency movements. Unfavourable monsoon pattern leads to declining rural demand. Delayed pick up in macro-economic indicators. Profit & Loss Account (Consolida ted) Ba la nce Sheet (Consolida ted) FY15A FY16E FY17E 174.4 175.7 Share Capital Ba la nce Sheet (Consolida ted) Reserve & 2,481.6 3,178.5 surplus 2,656.0 3,354.1 Net Worth Minority 15.9 18.2 Interest 708.1 733.6 Total debt Deferred tax 44.8 58.7 liability Other non40.9 46.2 current liabilities Capital 3,465.7 4,210.8 Employed 175.7 175.7 Y/E (Rs. Crores) Fixed Assets Investments Loans & advances Net Current Assets Other noncurrent assets Capital Deployed FY14A 3,791.0 4,926.9 3,966.6 5,102.5 FY14A FY15A FY16E FY17E 18.2 18.2 618.1 556.3 27.0 Net Revenue 7,054.1 7,806.4 8,624.2 9,108.2 Expenses 5,895.3 6,487.4 7,199.4 7,337.5 EBITDA 1,158.8 1,319.0 1,424.8 1,770.7 27.0 Other Income 128.1 158.1 209.3 249.1 46.2 46.2 Depreciation 97.5 115.0 122.7 127.4 1,161.0 1,352.0 1,511.3 1,892.3 4,676.1 5,750.2 Interest 54.2 40.1 30.9 27.8 Profit Before Tax 1,106.9 1,311.8 1,480.4 1,864.5 219.1 250.9 266.5 317.0 887.8 1,061.0 1,214.0 1,547.5 2.5 2.6 0.0 0.0 885.3 1,058.3 1,214.0 1,547.5 EBIT 1,788.6 1,927.5 1,904.8 1,877.4 492.6 1,407.4 1,407.0 1,407.0 24.5 20.8 22.2 22.2 1,141.9 835.1 1,322.0 2,423.5 18.1 20.1 20.1 20.1 3,465.7 4,210.8 4,676.1 5,750.2 Tax Profit Tax After Minority Interest Net Profit Va lua tion a nd view FY14A FY15A FY16E FY17E EBITDA Margin (%) 16.0 16.7 16.5 19.4 EBIT Margin (%) 16.9 17.4 17.5 20.8 NPM (%) 12.5 13.5 14.0 16.9 ROCE (%) 35.1 36.3 34.1 35.6 ROE (%) 37.3 35.2 32.3 32.8 EPS (Rs.) 5.1 6.0 6.9 8.8 P/E (x) 47.3 46.0 40.1 31.4 BVPS(Rs.) 15.2 19.1 23.7 30.1 P/BVPS (x) 15.8 14.5 11.7 9.2 EV/EBITDA (x) 37.2 37.5 34.7 27.3 For private circulation only (Rs. Profit & Loss Account (Consolida ted) Key Ra tios (Consolida ted) Y/E Y/E Crores) We expect Dabur to benefit from the revival of its brand image and enhanced rural reach. It is also well placed to benefit from its innovative brand offerings. The company generates ~8% of free cash flow to sales each year and has been increasing earnings at 15%-20% annually over the past eight years. We expect the top-line to grow at a CAGR of 8% by FY17E. At the current market price (CMP) of Rs. 277, the stock trades at a P/E multiple of 40.1x FY16E and 31.4x FY17E. We recommend ‘BUY’ with a target price of Rs. 344, assigning a forward P/E multiple of 39x, which implies a potential upside of ~24% to the CMP from 12 months perspective. Disclaimer : This document has been prepared by Funds India and Dion Global Solution Ltd. (the company) and is being distributed in India by Funds India. The information in the document has been compiled by the research department. Due care has been taken in preparing the above document. However, this document is not, and should not be construed, as an offer to sell or solicitation to buy any securities. Any act of buying, selling or otherwise dealing in any securities referred to in this document shall be at investor’s sole risk and responsibility. This document may not be reproduced, distributed or published, in whole or in part, without prior permission from the Company. © Copyright – 2015 - Dion Global Solution Ltd and Funds India. Funds India H.M Center, Second Floor, 29, Nungambakkam High Road, Nungambakkam, Chennai - 600 034. T: +91 7667 166 166 Email: contact@fundsindia.com
