Three Basic Choices for Beating the Market
advertisement
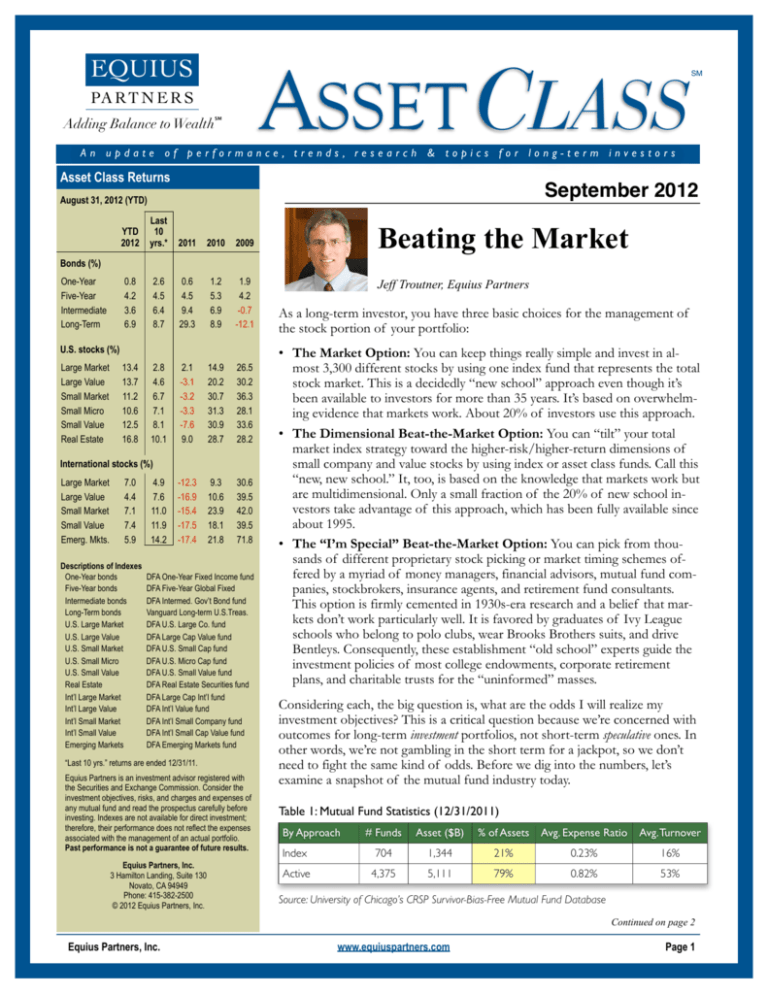
ASSET CLASS EQUIUS PA R T N E R S Adding Balance to Wealth℠ SM An update of performance, trends, research & topics for long-term investors Asset Class Returns September 2012 August 31, 2012 (YTD) YTD 2012 Last 10 yrs.* 2011 2010 2009 0.8 4.2 3.6 6.9 2.6 4.5 6.4 8.7 0.6 4.5 9.4 29.3 1.2 5.3 6.9 8.9 1.9 4.2 -0.7 -12.1 13.4 13.7 11.2 10.6 12.5 16.8 2.8 4.6 6.7 7.1 8.1 10.1 2.1 -3.1 -3.2 -3.3 -7.6 9.0 14.9 20.2 30.7 31.3 30.9 28.7 26.5 30.2 36.3 28.1 33.6 28.2 -12.3 -16.9 -15.4 -17.5 -17.4 9.3 10.6 23.9 18.1 21.8 30.6 39.5 42.0 39.5 71.8 Beating the Market Bonds (%) One-Year Five-Year Intermediate Long-Term U.S. stocks (%) Large Market Large Value Small Market Small Micro Small Value Real Estate International stocks (%) Large Market Large Value Small Market Small Value Emerg. Mkts. 7.0 4.4 7.1 7.4 5.9 Descriptions of Indexes One-Year bonds Five-Year bonds Intermediate bonds Long-Term bonds U.S. Large Market U.S. Large Value U.S. Small Market U.S. Small Micro U.S. Small Value Real Estate Int’l Large Market Int’l Large Value Int’l Small Market Int’l Small Value Emerging Markets 4.9 7.6 11.0 11.9 14.2 DFA One-Year Fixed Income fund DFA Five-Year Global Fixed DFA Intermed. Gov’t Bond fund Vanguard Long-term U.S.Treas. DFA U.S. Large Co. fund DFA Large Cap Value fund DFA U.S. Small Cap fund DFA U.S. Micro Cap fund DFA U.S. Small Value fund DFA Real Estate Securities fund DFA Large Cap Int’l fund DFA Int’l Value fund DFA Int’l Small Company fund DFA Int’l Small Cap Value fund DFA Emerging Markets fund “Last 10 yrs.” returns are ended 12/31/11. Equius Partners is an investment advisor registered with the Securities and Exchange Commission. Consider the investment objectives, risks, and charges and expenses of any mutual fund and read the prospectus carefully before investing. Indexes are not available for direct investment; therefore, their performance does not reflect the expenses associated with the management of an actual portfolio. Past performance is not a guarantee of future results. Equius Partners, Inc. 3 Hamilton Landing, Suite 130 Novato, CA 94949 Phone: 415-382-2500 © 2012 Equius Partners, Inc. Jeff Troutner, Equius Partners As a long-term investor, you have three basic choices for the management of the stock portion of your portfolio: • The Market Option: You can keep things really simple and invest in almost 3,300 different stocks by using one index fund that represents the total stock market. This is a decidedly “new school” approach even though it’s been available to investors for more than 35 years. It’s based on overwhelming evidence that markets work. About 20% of investors use this approach. • The Dimensional Beat-the-Market Option: You can “tilt” your total market index strategy toward the higher-risk/higher-return dimensions of small company and value stocks by using index or asset class funds. Call this “new, new school.” It, too, is based on the knowledge that markets work but are multidimensional. Only a small fraction of the 20% of new school investors take advantage of this approach, which has been fully available since about 1995. • The “I’m Special” Beat-the-Market Option: You can pick from thousands of different proprietary stock picking or market timing schemes offered by a myriad of money managers, financial advisors, mutual fund companies, stockbrokers, insurance agents, and retirement fund consultants. This option is firmly cemented in 1930s-era research and a belief that markets don’t work particularly well. It is favored by graduates of Ivy League schools who belong to polo clubs, wear Brooks Brothers suits, and drive Bentleys. Consequently, these establishment “old school” experts guide the investment policies of most college endowments, corporate retirement plans, and charitable trusts for the “uninformed” masses. Considering each, the big question is, what are the odds I will realize my investment objectives? This is a critical question because we’re concerned with outcomes for long-term investment portfolios, not short-term speculative ones. In other words, we’re not gambling in the short term for a jackpot, so we don’t need to fight the same kind of odds. Before we dig into the numbers, let’s examine a snapshot of the mutual fund industry today. Table 1: Mutual Fund Statistics (12/31/2011) By Approach # Funds Asset ($B) % of Assets Avg. Expense Ratio Avg. Turnover Index 704 1,344 21% 0.23% 16% Active 4,375 5,111 79% 0.82% 53% Source: University of Chicago’s CRSP Survivor-Bias-Free Mutual Fund Database Continued on page 2 Equius Partners, Inc. www.equiuspartners.com Page 1 According to the data in Table 1, the 79% of actively managed mutual fund assets have expenses almost four times those of index funds and experience three times the portfolio turnover. Higher expenses alone decrease the likelihood of achieving better-than-market returns through active management. The Market Return Table 2 shows the total U.S. stock market return for various periods, starting in 1928. The longer term returns average around 9%. With inflation averaging 3%, the real expected return on stocks is 6%. This number can be thought of as the “risk premium” investors receive for owning stocks over risk-free assets (such as Treasury Bills). Table 2: Annual Compound Return Ended 2011 Index Since 1928 Since 1973 Since 1995 Last 10 Years Total Stock Market 9.5% 10.0% 8.5% 3.8% Source: Dimensional Index data, Dimensional Fund Advisors The past 10 years saw big swings in market returns as well as a lower-than-average annual return. If ever there was a period when the securities research and forecasting skills of active managers could shine, it was this one. But as we’ll see, active management failed miserably—again. Investors can realize the market return, minus a very modest expense of 0.06%, by purchasing a total stock market index fund such as Vanguard’s. This is the bar active managers must clear (minus much higher expenses) at a minimum. We’ll see in a moment how well they’ve done. But first, let’s review other dimensions of the market that reward investors with fairly consistent risk premiums. The Multidimensional Market Return Table 3: Annual Compound Returns Ended 2011 Index Since 1928 Since 1973 Since 1995 Last 10 Years Total Stock Market 9.5% 10.0% 8.5% 3.8% U.S. Large Value Stocks 10.4% 12.2% 8.5% 2.0% U.S. Small Value Stocks 12.9% 15.5% 13.4% 9.2% Source: Dimensional Index data, Dimensional Fund Advisors Total stock market return can be captured reliably from an index fund, but capturing the small cap and value risk premiums requires the fund manager to build the right “passive” security selection structure and then manage it effectively. For a number of reasons that we’ve covered often in the past, trying to capture these risk premiums with traditional indexes is difficult, particularly on the small cap side, where market impact (the additional cost of buying or selling less liquid securities) can be huge. Therefore, the choice of an index fund manager is quite important. The premiums are not totally reliable over shorter time periods, as the data for U.S. large value stocks shown in Table 3 (yellow cells) indicates. Trying to capture these premiums through active management is a fool’s game that is likely to diminish reliability even further. The lack of diversification, consistent structure, and disciplined application that characterize active management undermines most efforts. Charts 1 and 2 show the persistence of the small cap and value risk premiums over various rolling periods. Chart 1: U.S. Value vs. U.S. Growth Overlapping Periods, July 1926 - December 2011 High-speed computers, sophisticated and powerful software, contributions from major donors to finance and economics departments at key universities, and hungry grad students have been a godsend to the investment industry outside of Wall Street. In fact, a rather ironic funding of the Center for Research in Securities Prices (CRSP) at the University of Chicago by Merrill Lynch has done more than perhaps anything else over the past 50 years to expose the myths of oldschool investing. In previous Asset Class articles, I’ve outlined how Eugene Fama and Ken French developed their Three Factor Model of market risk dimensions, using CRSP stock data extending back to the 1920s. They found that diversified portfolios of small company and value stocks represent risk factors independent from the total market. In other words, investors can expect to receive Equius Partners, Inc. higher returns from those asset classes over time, due to their higher risk. Table 3 summarizes this risk perspective, using returns for the total market, for U.S. large value, and for U.S. small value stocks since 1928. In 25-Year Periods Value beats growth 100% of the time. In 20-Year Periods Value beats growth 100% of the time. In 15-Year Periods Value beats growth 95% of the time. In 10-Year Periods Value beats growth 91% of the time. In 5-Year Periods Value beats growth 81% of the time. Periods based on rolling annualized returns. 727 total 25-year periods. 787 total 20-year periods. 847 total 15-year periods. 895 total 10-year periods. 967 total 5-year periods. Returns based on Fama/ French Research Factors. Source: Dimensional Fund Advisors Asset Class Newsletter Continued on page 3 Page 2 Chart 2: U.S. Small vs. U.S. Large Table 4: 10-Year Survival Rates of U.S. Active Funds Overlapping Periods, July 1926 - December 2011 By Category In 25-Year Periods Small beats large 97% of the time. In 20-Year Periods Small beats large 88% of the time. In 15-Year Periods Small beats large 82% of the time. In 10-Year Periods In 5-Year Periods Small beats large 75% of the time. Small beats large 59% of the time. See explanation with Chart 1 The data indicate that tilting away from a total market portfolio to higher-risk small cap and value stocks produces higher expected returns over time, and the value risk premium is more reliable than the small cap risk premium. But these tilts add a degree of short-term uncertainty and risk that investors must accept if their long-term objective is to exceed the market return. These same relationships exist with small cap and value stocks in international markets. Next, we’ll look at the unique risks and portfolio uncertainty that active managers introduce to the equation. Survival Rate Stocks Large Core 277 119 43% Large Growth 334 123 37% Large Value 125 56 45% Mid Cap Core 63 37 59% Mid Cap Growth 175 80 46% Mid Cap Value 93 67 72% Small Cap Core 103 63 61% Small Cap Growth 171 85 50% Small Cap Value 138 95 69% Multi Cap Core 139 77 55% Multi Cap Growth 186 71 38% Multi Cap Value 266 147 55% Real Estate 68 40 59% Government 66 35 53% Gov’t Intermediate 88 48 55% Gov’t Short-term 51 29 57% Corporate 160 80 50% Corporate Intermediate 207 103 50% Corporate Short-term 54 36 67% High Yield 146 86 59% TIPS 10 7 70% Bonds Source: CRSP Survivor-Bias-Free Mutual Fund Database. “Core” represents funds that combine value and growth Are They Really Special? To critique the performance of active fund managers, we use the CRSP Survivorship-Bias-Free Mutual Fund Database. This eliminates the significant bias built into databases favored by active managers (such as the Morningstar Mutual Fund database) that omit closed or merged funds from the sample. Funds are closed or merged almost always because of poor performance relative to unmanaged benchmarks, and their omission from the database skews active performance upward. So the first thing to look for when evaluating active fund manager performance are fund survivor rates. Table 4 shows mutual fund survivor rates over the past 10 years (2002 – 2011). As you can see, the record’s not good. These poor survival rates introduce a significant and unique risk to active management, of which most fund investors are unaware. Shifting among active strategies (using funds, independent money managers, financial advisors, etc.) is already a common voluntary mistake investors make. Being forced to change by the closing or merging of a fund is just salt in the wound. Now let’s look at how the survivors performed by stock risk dimension over the period (Chart 3). In every category, the market won—decisively in most cases. Equius Partners, Inc. # Funds at # Funds That Start Survived Chart 3: Stock Fund Winners and Losers Losers Winners 95% Large Core 5% Large Growth 87% 13% Large Value 88% 12% Mid Cap Core 94% 6% Mid Cap Growth 91% 9% Mid Cap Small 88% 12% Small Cap Core 68% 77% Small Cap Growth Small Cap Value Multi Cap Core Multi Cap Growth 32% 54% 23% 46% 82% 77% 18% 23% Multi Cap Value 82% 18% Real Estate 82% 18% Source: CRSP Survivor-Bias-Free Mutual Fund Database. “Core” represents funds that combine value and growth Asset Class Newsletter Continued on page 4 Page 3 Not surprisingly, we see the same lack of active management talent with fixed income management. It’s clear that the odds of selecting a superior, marketbeating stock or bond fund manager are very slim. Chart 4: Bond Fund Winners and Losers Losers Winners Government 81% 19% Gov’t Intermediate 80% 20% Gov’t Short-term 78% 22% 84% Corporate 16% 76% Corp. Intermediate 24% 83% Corp. Short-term 17% 97% High Yield 3% 100% TIPS Source: CRSP Survivor-Bias-Free Mutual Fund Database Finally, let’s look at how the winners do after they’ve been identified as the winners (after all, we can know which ones they are in advance only by using a crystal ball). For this exercise, we look at the number of funds in each category at the start of 2002, observe how many were still around five years later, identify the ones that beat their benchmarks over those five years, and check how well those fund managers did against their benchmarks for the next five years (ended 2011). Table 5 shows the results for U.S. stock funds. Table 5: Persistence of “Winners” (U.S. Stock Funds) By Category # Funds at Start in 2002 # Funds That Survived to 2006 % of Winners that Became Losers Over the Next Five Years Large Core 277 167 (60%) 83% Large Growth 334 197 (59%) 77% Large Value 125 86 (69%) 50% Mid Cap Core 63 50 (79%) 100% Mid Cap Growth 175 126 (72%) 71% Mid Cap Value 93 82 (88%) 60% Small Cap Core 103 82 (80%) 62% Small Cap Growth 171 121 (71%) 72% Small Cap Value 138 120 (87%) 26% Multi Cap Core 139 104 (75%) 70% Multi Cap Growth 186 108 (58%) 81% Multi Cap Value 266 202 (76%) 55% Real Estate 68 52 (76%) 64% Source: CRSP Survivor-Bias-Free Mutual Fund Database Equius Partners, Inc. Conclusion For some investors, the goal of capturing the total stock market return for a designated portion of their total portfolio is sufficient to meet their long-term objectives. These investors can be highly confident that as long as markets work (i.e., they price stocks efficiently enough that the “I’m special” cohort can’t consistently outperform them), they can meet their goals with a low-cost and highly diversified index fund. For other investors who need or want a higher return than the overall market will provide, the choice between the other two options is easy. A wellstructured, indexed portfolio tilted to the other risk dimensions of the market—small cap and value stocks —can deliver higher expected returns much more reliably than can active management. The choice of index funds (more appropriately, asset class funds) to build a multidimensional portfolio is important, however. We’ve covered this topic in past Asset Class articles and won’t repeat the analysis here. The main point is that the conventional index benchmarks on which most index funds are based have not done a good job of capturing small cap and value return premiums. All the great research coming out of the University of Chicago’s Booth School of Business and other prominent academic finance and economics departments would be wasted if firms like Dimensional Fund Advisors didn’t exist and investors didn’t have access to tools designed specifically to exploit the research. It remains a profound mystery to me that active management as a long-term investment strategy survives, especially in light of the high costs, low fund survivor rates, low success rates of the surviving funds, and the lack of persistence on the part of the surviving “winners” to beat the market in the future. That 80% of the investing public allows their most serious assets to be managed this way is simply mind-boggling. Active management is clearly a triumph of hope over experience. New tools such as the CRSP SurvivorshipBias-Free Mutual Fund Database can do only so much to shed light on this issue. Until the investment industry becomes more professional and evidencebased and the media puts itself on the side of investors instead of the industry, little will change to improve outcomes for the majority of long-term investors. For purposes of this article, “winners” are active fund managers who beat the market return and “losers” are those who failed. We’re sure they’re all winners in other aspects of their lives. Past performance is no guarantee of future results. Indexes are not available for investment. Index returns assume reinvestment of all distributions and, unlike mutual funds, do not reflect fees or expenses. Diversification does not eliminate the risk of market loss. This information is for educational purposes only and should not be considered investment advice or an offer of any security for sale. Asset Class Newsletter Page 4
