Hardy-Weinberg Equilibrium & Gene Frequencies Worksheet
advertisement
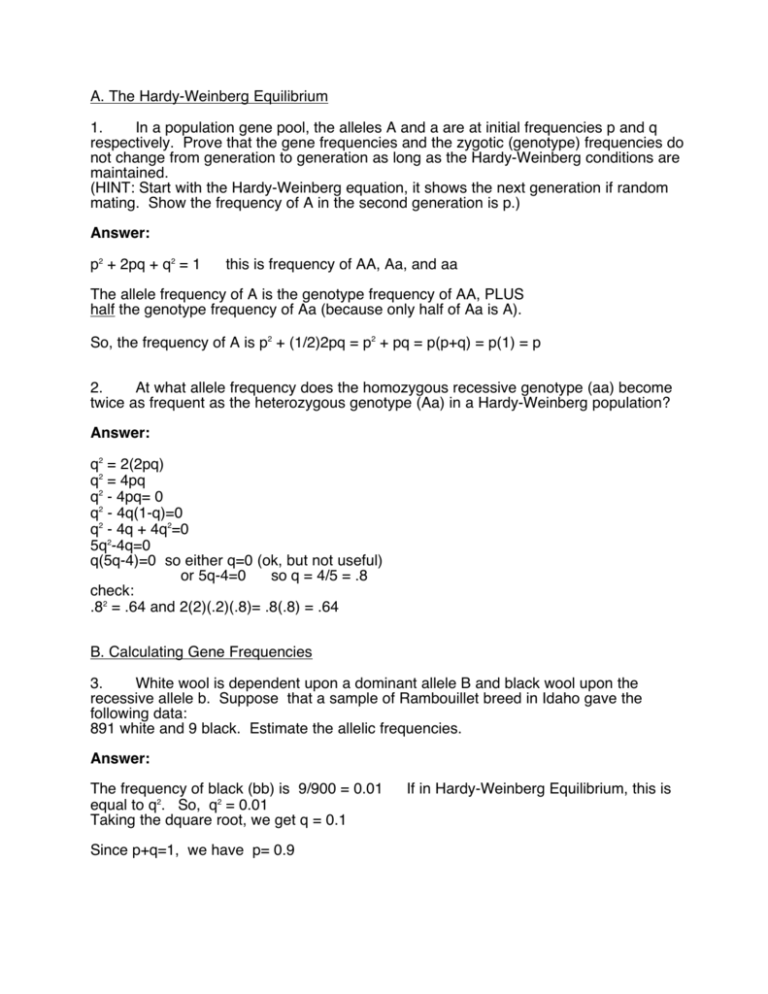
A. The Hardy-Weinberg Equilibrium 1. In a population gene pool, the alleles A and a are at initial frequencies p and q respectively. Prove that the gene frequencies and the zygotic (genotype) frequencies do not change from generation to generation as long as the Hardy-Weinberg conditions are maintained. (HINT: Start with the Hardy-Weinberg equation, it shows the next generation if random mating. Show the frequency of A in the second generation is p.) Answer: p2 + 2pq + q2 = 1 this is frequency of AA, Aa, and aa The allele frequency of A is the genotype frequency of AA, PLUS half the genotype frequency of Aa (because only half of Aa is A). So, the frequency of A is p2 + (1/2)2pq = p2 + pq = p(p+q) = p(1) = p 2. At what allele frequency does the homozygous recessive genotype (aa) become twice as frequent as the heterozygous genotype (Aa) in a Hardy-Weinberg population? Answer: q2 = 2(2pq) q2 = 4pq q2 - 4pq= 0 q2 - 4q(1-q)=0 q2 - 4q + 4q2=0 5q2-4q=0 q(5q-4)=0 so either q=0 (ok, but not useful) or 5q-4=0 so q = 4/5 = .8 check: .82 = .64 and 2(2)(.2)(.8)= .8(.8) = .64 B. Calculating Gene Frequencies 3. White wool is dependent upon a dominant allele B and black wool upon the recessive allele b. Suppose that a sample of Rambouillet breed in Idaho gave the following data: 891 white and 9 black. Estimate the allelic frequencies. Answer: The frequency of black (bb) is 9/900 = 0.01 equal to q2. So, q2 = 0.01 Taking the dquare root, we get q = 0.1 Since p+q=1, we have p= 0.9 If in Hardy-Weinberg Equilibrium, this is C. Testing a Locus for Equilibrium 4. One of the “breeds” of poultry are for “frizzled” feathers, built on one gene locus. FF - normal feathers, FF’ - “frizzled” , F’F’ - “woolies” (extremely frizzled) A sample of 1000 individuals of this “breed” in the US contained 800 frizzled, 150 normal, and 50 wooly birds. Is this population in equilibrium? Answer: Let p = frequency of F’ allele = 2(50) + 800 = 2(1000) 0.45 q = frequency of F allele = 1 - .45 = .55 Genotypes FF FF’ F’F’ Eqbm Freq p2 2pq q2 Calculations (.45)2 = .2025 2(.45)(.55) = .4950 (.55)2 = .3025 Expected numbers 202.5 495.0 302.5 These are NOT the numbers we actually have. But is there a STATISTICALLY SIGNIFICANT difference? The Chi square test can be used here to test for conformity to equilibrium expectations. Phenotype wooly frizzle normal o 50 800 150 e 202.5 495.0 302.5 (o - e) -152.5 +305.0 -152.5 df = #phenotypes - #alleles = 3 - 2 = 1 (o - e)2 23,256 93,025 23,256 (o - e)2 / e 114.8 187.9 76.9 397.6 p < 0.01 This highly significant chi square value will not allow us to accept the hypothesis of conformity to the equilibrium expectations. (Artificial selection against normal birds and natural selection against wooly birds is in effect. Normal birds are culled to preserve the breed. Wooly birds lose feathers and mature late, so leave fewer offspring.) The population is NOT in Hardy-Weinberg equilibrium.
