Population Genetics Worksheet: Drift, Selection, Equilibrium
advertisement
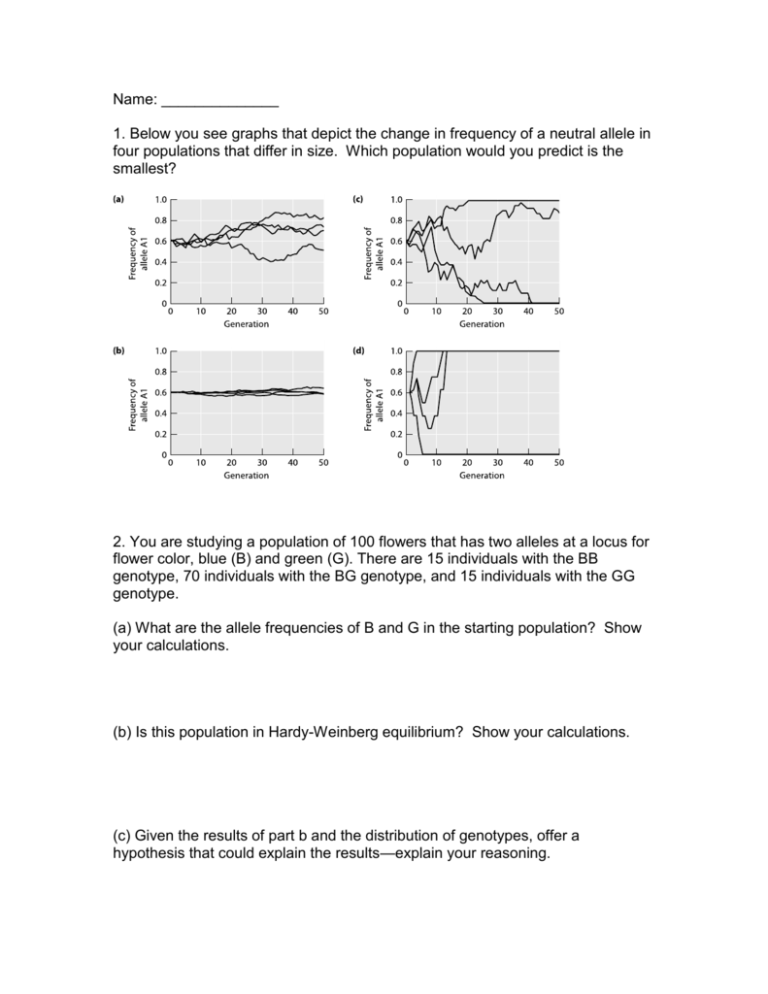
Name: ______________ 1. Below you see graphs that depict the change in frequency of a neutral allele in four populations that differ in size. Which population would you predict is the smallest? 2. You are studying a population of 100 flowers that has two alleles at a locus for flower color, blue (B) and green (G). There are 15 individuals with the BB genotype, 70 individuals with the BG genotype, and 15 individuals with the GG genotype. (a) What are the allele frequencies of B and G in the starting population? Show your calculations. (b) Is this population in Hardy-Weinberg equilibrium? Show your calculations. (c) Given the results of part b and the distribution of genotypes, offer a hypothesis that could explain the results—explain your reasoning. 3. Discuss the effectiveness of genetic drift and natural selection in small vs. large populations. Please be sure to explain why each process is stronger/weaker depending on the population size. 4. How can reaction norms be used to understand phenotypic plasticity?

