Biology 130 – Molecular Biology and Genetics
advertisement
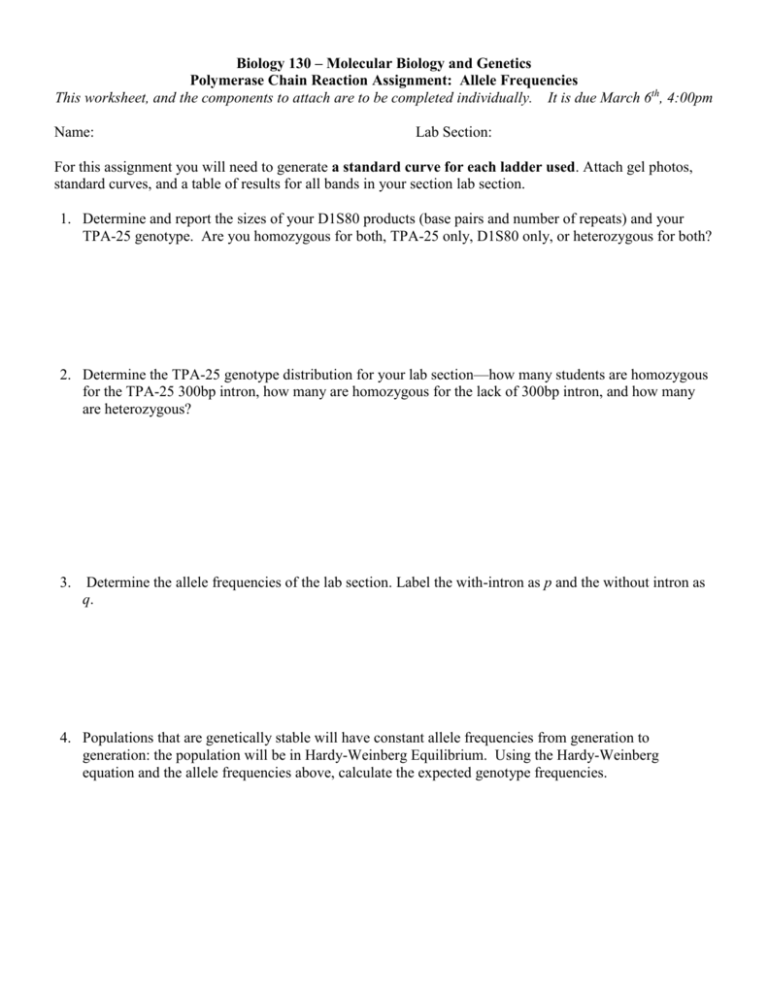
Biology 130 – Molecular Biology and Genetics Polymerase Chain Reaction Assignment: Allele Frequencies This worksheet, and the components to attach are to be completed individually. It is due March 6th, 4:00pm Name: Lab Section: For this assignment you will need to generate a standard curve for each ladder used. Attach gel photos, standard curves, and a table of results for all bands in your section lab section. 1. Determine and report the sizes of your D1S80 products (base pairs and number of repeats) and your TPA-25 genotype. Are you homozygous for both, TPA-25 only, D1S80 only, or heterozygous for both? 2. Determine the TPA-25 genotype distribution for your lab section—how many students are homozygous for the TPA-25 300bp intron, how many are homozygous for the lack of 300bp intron, and how many are heterozygous? 3. Determine the allele frequencies of the lab section. Label the with-intron as p and the without intron as q. 4. Populations that are genetically stable will have constant allele frequencies from generation to generation: the population will be in Hardy-Weinberg Equilibrium. Using the Hardy-Weinberg equation and the allele frequencies above, calculate the expected genotype frequencies. 5. We can examine the differences between expected and observed genotype frequencies using the Chisquared test(2). This should be familiar from the FlyLab. Now you will do the test by hand—it is very straight forward. observed frequency expected frequency 2 2 expected frequency indicates “sum of” You have three observed genotype frequencies and three expected genotype frequencies. Calculate each and observed frequency expected frequency 2 add them together to arrive at the Chi-Square. expected frequency 6. Compare the value you calculated to the value from the Chi-squared table, dependent on how many groups are compared. With three groups the critical value is 2 =5.99. If the calculated value is less than 5.99 accept the null hypothesis (that there is no difference between the expected and observed values: the population is in Hardy-Weinberg Equilibrium. If the value calculated is greater than or equal to 5.99 reject the null hypothesis (the population is not in Hardy-Weinberg Equilibrium). Based on your calculated 2 , is your lab section in Hardy-Weinberg Equilibrium? 7. What are three factors that disrupt Hardy-Weinberg Equilibrium that could affect the lab section (regardless of the results above)?
