BT Group plc fact sheet
advertisement
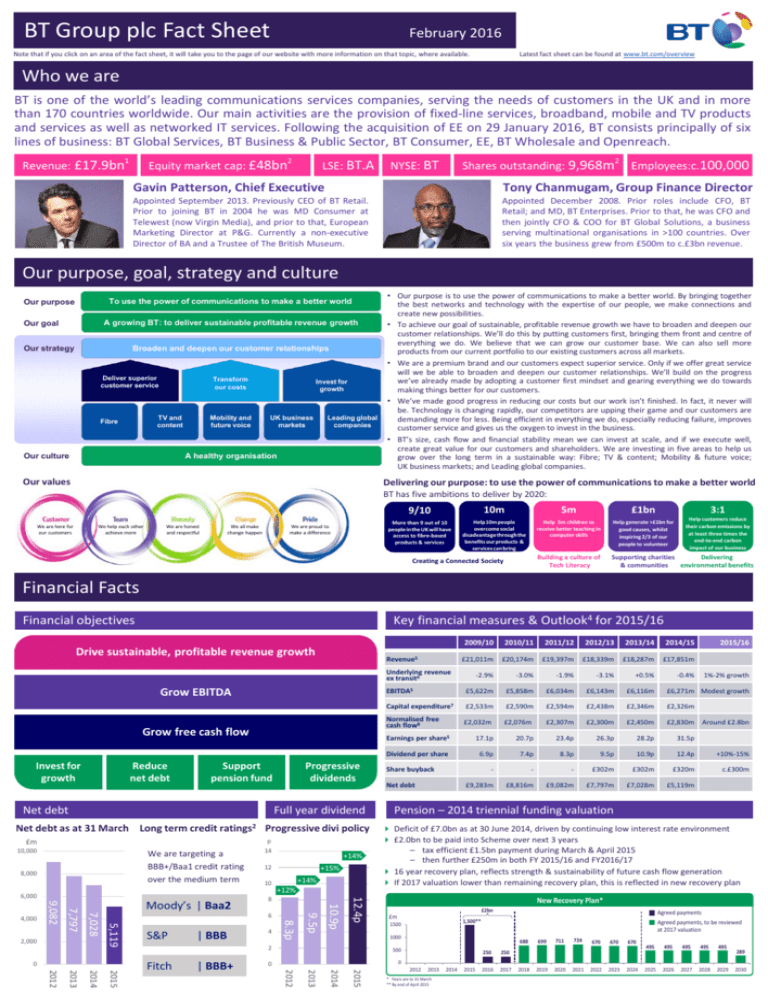
BT Group plc Fact Sheet February 2016 Note that if you click on an area of the fact sheet, it will take you to the page of our website with more information on that topic, where available. Latest fact sheet can be found at www.bt.com/overview Who we are BT is one of the world’s leading communications services companies, serving the needs of customers in the UK and in more than 170 countries worldwide. Our main activities are the provision of fixed-line services, broadband, mobile and TV products and services as well as networked IT services. Following the acquisition of EE on 29 January 2016, BT consists principally of six lines of business: BT Global Services, BT Business & Public Sector, BT Consumer, EE, BT Wholesale and Openreach. Revenue: £17.9bn 1 2 Equity market cap: £48bn LSE: BT.A Shares outstanding: 9,968m NYSE: BT 2 Employees:c.100,000 Gavin Patterson, Chief Executive Tony Chanmugam, Group Finance Director Appointed September 2013. Previously CEO of BT Retail. Prior to joining BT in 2004 he was MD Consumer at Telewest (now Virgin Media), and prior to that, European Marketing Director at P&G. Currently a non-executive Director of BA and a Trustee of The British Museum. Appointed December 2008. Prior roles include CFO, BT Retail; and MD, BT Enterprises. Prior to that, he was CFO and then jointly CFO & COO for BT Global Solutions, a business serving multinational organisations in >100 countries. Over six years the business grew from £500m to c.£3bn revenue. Our purpose, goal, strategy and culture To use the power of communications to make a better world Our purpose A growing BT: to deliver sustainable profitable revenue growth Our goal Our strategy Broaden and deepen our customer relationships Deliver superior customer service Transform our costs TV and content Fibre Our culture Mobility and future voice Invest for growth UK business markets Leading global companies A healthy organisation Our values • Our purpose is to use the power of communications to make a better world. By bringing together the best networks and technology with the expertise of our people, we make connections and create new possibilities. • To achieve our goal of sustainable, profitable revenue growth we have to broaden and deepen our customer relationships. We’ll do this by putting customers first, bringing them front and centre of everything we do. We believe that we can grow our customer base. We can also sell more products from our current portfolio to our existing customers across all markets. • We are a premium brand and our customers expect superior service. Only if we offer great service will we be able to broaden and deepen our customer relationships. We’ll build on the progress we’ve already made by adopting a customer first mindset and gearing everything we do towards making things better for our customers. • We’ve made good progress in reducing our costs but our work isn’t finished. In fact, it never will be. Technology is changing rapidly, our competitors are upping their game and our customers are demanding more for less. Being efficient in everything we do, especially reducing failure, improves customer service and gives us the oxygen to invest in the business. • BT’s size, cash flow and financial stability mean we can invest at scale, and if we execute well, create great value for our customers and shareholders. We are investing in five areas to help us grow over the long term in a sustainable way: Fibre; TV & content; Mobility & future voice; UK business markets; and Leading global companies. Delivering our purpose: to use the power of communications to make a better world BT has five ambitions to deliver by 2020: We are here for our customers We help each other achieve more We are honest and respectful We all make change happen We are proud to make a difference 9/10 10m 5m £1bn 3:1 More than 9 out of 10 people in the UK will have access to fibre-based products & services Help 10m people overcome social disadvantage through the benefits our products & services can bring Help 5m children to receive better teaching in computer skills Help generate >£1bn for good causes, whilst inspiring 2/3 of our people to volunteer Help customers reduce their carbon emissions by at least three times the end-to-end carbon impact of our business Building a culture of Tech Literacy Supporting charities Delivering & communities environmental benefits Creating a Connected Society Financial Facts Key financial measures & Outlook4 for 2015/16 Financial objectives Drive sustainable, profitable revenue growth Revenue5 2009/10 2010/11 2011/12 2012/13 2013/14 2014/15 £21,011m £20,174m £19,397m £18,339m £18,287m £17,851m -0.4% Underlying revenue ex transit6 Grow EBITDA Grow free cash flow Invest for growth Reduce net debt Support pension fund Net debt Full year dividend Net debt as at 31 March Long term credit ratings2 Progressive divi policy p £m 10,000 We are targeting a BBB+/Baa1 credit rating over the medium term 8,000 14 +14% 12 +15% +14% 10 +12% -2.9% -3.0% -1.9% -3.1% +0.5% EBITDA5 £5,622m £5,858m £6,034m £6,143m £6,116m £6,271m Modest growth Capital expenditure7 £2,533m £2,590m £2,594m £2,438m £2,346m £2,326m Normalised free cash flow8 £2,032m £2,076m £2,307m £2,300m £2,450m £2,830m Around £2.8bn Earnings per share5 17.1p 20.7p 23.4p 26.3p 28.2p Dividend per share 6.9p 7.4p 8.3p 9.5p 10.9p 12.4p +10%-15% - - - £302m £302m £320m c.£300m £9,283m £8,816m £9,082m £7,797m £7,028m £5,119m Share buyback Net debt 1%-2% growth 31.5p Pension – 2014 triennial funding valuation Deficit of £7.0bn as at 30 June 2014, driven by continuing low interest rate environment £2.0bn to be paid into Scheme over next 3 years – tax efficient £1.5bn payment during March & April 2015 – then further £250m in both FY 2015/16 and FY2016/17 16 year recovery plan, reflects strength & sustainability of future cash flow generation If 2017 valuation lower than remaining recovery plan, this is reflected in new recovery plan 10.9p New Recovery Plan* £2bn £m Agreed payments 1,500** 1500 Agreed payments, to be reviewed at 2017 valuation 1000 2 500 0 0 2015 2014 2013 | BBB+ 4 2012 2015 2014 2013 2012 Fitch | BBB 9.5p 0 S&P 8.3p 2,000 6 5,119 7,028 7,797 9,082 Moody’s | Baa2 8 12.4p 6,000 4,000 Progressive dividends 2015/16 2012 2013 * Years are to 31 March ** By end of April 2015 2014 2015 250 250 2016 2017 688 699 711 2018 2019 2020 724 2021 670 670 670 2022 2023 2024 495 495 495 495 495 2025 2026 2027 2028 2029 289 2030 BT Group financial overview1 (pre EE) Structure of BT BT Global Services BT Business BT Consumer BT Wholesale EE BT Group EBITDA5 BT Group external revenue5 Openreach BT Global Services BT Business 11% Technology, Service & Operations (internal) 12% In the UK we are a leading communications services provider, selling products and services to consumers, small and medium sized enterprises and the public sector. We also sell wholesale products and services to communications providers in the UK and around the world. Globally, we supply managed networked IT services to multinational corporations, domestic businesses and national and local government organisations. BT Global Services BT Business 17% 38% 41% BT Consumer BT Consumer 17% BT Wholesale BT Wholesale 24% 15% 16% 9% Openreach Openreach BT lines of business BT Global Services BT Business Revenue - u/l ex transit EBITDA Operating cash flow Order intake 2011/12 2012/13 2013/14 2014/15 £7,392m -5.8% £950m £314m £6,580m £7,269m -1.0% £1,041m £499m £7,280m £6,779m -4.0% £1,047m £349m £6,458m £948m £493m £6,947m 5% 5% 43% Continental Europe 20% US & Canada 31% Revenue - u/l ex transit EBITDA Operating cash flow Order intake 18% High-growth regions 2011/12 2012/13 2013/14 2014/15 £3,220m -2.0% £940m £816m £2,202m £3,213m -0.8% £1,002m £799m £2,098m £3,145m -1.4% £1,041m £874m £2,073m 10 Market share £939m £775m £1,835m Future plans Growing share of wallet with existing customers Financial institutions Developing new IP-based voice and data products Cross-selling from leading position in fixed line Transit Other global carrier BT Consumer 8 6 4 2 0 Source: IDC and BT 6% 1% 30% Fixed-voice and data BT Mobility Rest of market Addressable IT services market EE John Petter Serves around 10m residential customers in UK • Largest consumer fixed-voice & broadband provider in UK. Growing base of TV, BT Sport, and mobile customers. 2011/12 £3,925m Revenue - u/l ex transit EBITDA Operating cash flow Total consumer lines (‘000) Retail broadband (‘000) - of which fibre (‘000) TV customers (‘000) CEO 2012/13 £3,846m -2.0% £968m £655m 10,207 £883m £592m 10,919 6,280 515 707 2013/14 £4,019m 4.5% £833m £472m 9,908 6,704 1,236 810 60% 40% 20% 0% BT Sport: 3.3m direct customers & 1.9m wholesale3 Source: Ofcom 42% CEO Acquired 29 January 2016 No.1 in mobile for the UK 33% share of the mobile market 7,713 3,010 1,142 UK’s most advanced 4G network – 95% coverage & >14m 4G customers >31m connections of which >24m direct mobile customers Market share Market is increasingly triple-play Growing demand for faster broadband Marc Allera Serves >31m customers in the UK • Largest provider of mobile services in UK Growing base of broadband and TV customers 2014/15 £4,285m +6.6% £1,031m £813m 9,633 7,281 2,105 1,002 Market share Competitive market with several strong players 5% 31% Allows BT to accelerate mobility strategy Calls and lines Broadband TV BT Wholesale Openreach Nigel Stagg Provides network services and solutions to other communications providers (CPs) in UK • More than 1,400 CP customers Revenue - u/l ex transit EBITDA Operating cash flow Order intake CEO 2011/12 2012/13 2013/14 2014/15 £2,943m £2,608m -2.6% £620m £348m £2,031m £2,422m -3.0% £614m £372m £1,910m £2,157 -7.1% £561m £278m £1,908m £667m £259m £748m Key trends in our wholesale markets Revenue - u/l ex transit EBITDA Operating cash flow Physical lines (‘000) Broadband (‘000) - of which fibre (‘000) m Premises passed Continuing local loop unbundling (LLU) by main competitors Increased competition Growing demand for bandwidth across our broadband, Ethernet and media networks 2011/12 £5,187m 25 Premises passed with fibre (LHS) Take up % (RHS) 20% m 5 20 15% 4 15 10% 10 5 IR Director 1 0% 0 Mark Smith Evelyne Bull Jon Cox Joanna Gluzman Head Investor Relations Officer Senior Investor Relations Officer Strategy Specialist Investor Relations Director, SRI Engagement For the 2014/15 financial year ended 31 March 2015 As at 29 January 2016 3 As at 31 March 2015 4 On a BT stand alone basis, as given at Q3 2015/16 results on 1 February January 2016 5 Before specific items 6 Excludes specific items, foreign exchange movements and the effect of acquisitions and disposals 7 Before purchases of telecommunications licences. Accrued capex, rather than cash capex. 8 Before specific items, purchases of telecommunications licences, pension deficit payments and the cash tax benefit of pension deficit payments 2014/15 £5,011m -1.0% £2,600m £1,502m 25,302 19,306 4,193 Openreach fibre customers BT External 2 5% BT Investor Relations Carl Murdock-Smith 2013/14 £5,061m -1.1% £2,601m £1,492m 25,087 18,455 2,677 3 Q4 10/11 Q4 11/12 Q4 12/13 Q4 13/14 Q4 14/15 Group Investor Relations Director CEO 2012/13 £5,115m -1.4% £2,642m £1,475m 25,004 17,629 1,411 £2,618m £1,514m 24,950 16,795 538 0 Damien Maltarp Clive Selley Provides wholesale copper and fibre connections between BT’s exchanges and UK homes & businesses. 540 CP customers. • Widely regulated by Ofcom, operates at arm’s length Portfolio evolution towards IP-based services 1 2 CEO £3,294m Corporate Public sector 52% Graham Sutherland Serves around 900,000 SME customers in UK and Ireland • Leading position in fixed-voice, networking and broadband services. Also provides IT services & mobility. 2014/15 revenue by customer type UK 13% CEO £8,042m 2014/15 revenue by region 13% Luis Alvarez Market size (£bn) A global leader in managed networked IT services • Serves >6,500 large corporate & public sector customers in >170 countries, incl 98% of FTSE100, 82% of Fortune 500 While BT believes the information contained in this document to be reliable, BT does not warrant the accuracy, completeness or validity of the information, figures or calculations that follow and shall not be liable in any way for loss or damage arising out of the use of the information, or any errors or omissions in its content. Q4 10/11 Q4 11/12 Q4 12/13 Q4 13/14 Q4 14/15 +44 (0)20 7356 4909 tel: +44 (0)20 7356 4909 ir@bt.com email: ir@bt.com www.bt.com/ir web: www.bt.com/ir
