36 AP Lab Transpiration Report
advertisement

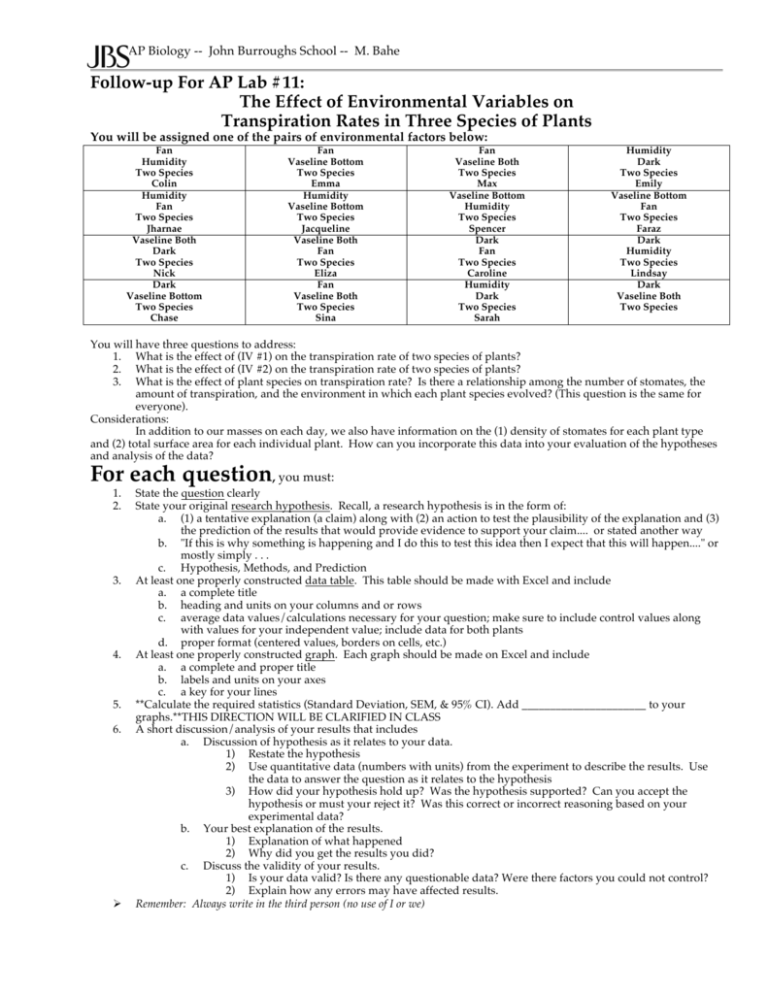
AP Biology -- John Burroughs School -- M. Bahe Follow-up For AP Lab #11: The Effect of Environmental Variables on Transpiration Rates in Three Species of Plants You will be assigned one of the pairs of environmental factors below: Fan Humidity Two Species Colin Humidity Fan Two Species Jharnae Vaseline Both Dark Two Species Nick Dark Vaseline Bottom Two Species Chase Fan Vaseline Bottom Two Species Emma Humidity Vaseline Bottom Two Species Jacqueline Vaseline Both Fan Two Species Eliza Fan Vaseline Both Two Species Sina Fan Vaseline Both Two Species Max Vaseline Bottom Humidity Two Species Spencer Dark Fan Two Species Caroline Humidity Dark Two Species Sarah Humidity Dark Two Species Emily Vaseline Bottom Fan Two Species Faraz Dark Humidity Two Species Lindsay Dark Vaseline Both Two Species You will have three questions to address: 1. What is the effect of (IV #1) on the transpiration rate of two species of plants? 2. What is the effect of (IV #2) on the transpiration rate of two species of plants? 3. What is the effect of plant species on transpiration rate? Is there a relationship among the number of stomates, the amount of transpiration, and the environment in which each plant species evolved? (This question is the same for everyone). Considerations: In addition to our masses on each day, we also have information on the (1) density of stomates for each plant type and (2) total surface area for each individual plant. How can you incorporate this data into your evaluation of the hypotheses and analysis of the data? For each question, you must: 1. 2. 3. 4. 5. 6. Ø State the question clearly State your original research hypothesis. Recall, a research hypothesis is in the form of: a. (1) a tentative explanation (a claim) along with (2) an action to test the plausibility of the explanation and (3) the prediction of the results that would provide evidence to support your claim.... or stated another way b. "If this is why something is happening and I do this to test this idea then I expect that this will happen...." or mostly simply . . . c. Hypothesis, Methods, and Prediction At least one properly constructed data table. This table should be made with Excel and include a. a complete title b. heading and units on your columns and or rows c. average data values/calculations necessary for your question; make sure to include control values along with values for your independent value; include data for both plants d. proper format (centered values, borders on cells, etc.) At least one properly constructed graph. Each graph should be made on Excel and include a. a complete and proper title b. labels and units on your axes c. a key for your lines **Calculate the required statistics (Standard Deviation, SEM, & 95% CI). Add ______________________ to your graphs.**THIS DIRECTION WILL BE CLARIFIED IN CLASS A short discussion/analysis of your results that includes a. Discussion of hypothesis as it relates to your data. 1) Restate the hypothesis 2) Use quantitative data (numbers with units) from the experiment to describe the results. Use the data to answer the question as it relates to the hypothesis 3) How did your hypothesis hold up? Was the hypothesis supported? Can you accept the hypothesis or must your reject it? Was this correct or incorrect reasoning based on your experimental data? b. Your best explanation of the results. 1) Explanation of what happened 2) Why did you get the results you did? c. Discuss the validity of your results. 1) Is your data valid? Is there any questionable data? Were there factors you could not control? 2) Explain how any errors may have affected results. Remember: Always write in the third person (no use of I or we)


