To determine the rate law for the reaction of crystal violet indicator
advertisement
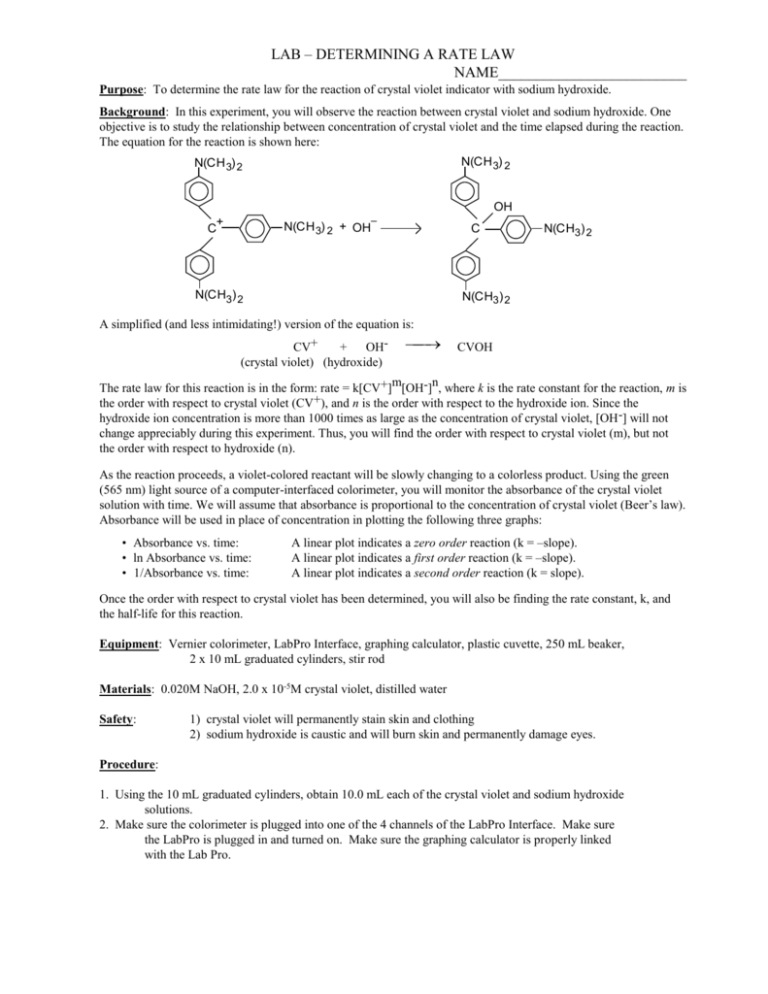
LAB – DETERMINING A RATE LAW NAME_________________________ Purpose: To determine the rate law for the reaction of crystal violet indicator with sodium hydroxide. Background: In this experiment, you will observe the reaction between crystal violet and sodium hydroxide. One objective is to study the relationship between concentration of crystal violet and the time elapsed during the reaction. The equation for the reaction is shown here: N(CH 3) 2 N(CH 3) 2 OH – + C N(CH 3) 2 + OH C N(CH3) 2 2 N(CH3) 2 N(CH3) 2 A simplified (and less intimidating!) version of the equation is: CV+ + OH(crystal violet) (hydroxide) CVOH m n The rate law for this reaction is in the form: rate = k[CV+] [OH-] , where k is the rate constant for the reaction, m is the order with respect to crystal violet (CV+), and n is the order with respect to the hydroxide ion. Since the hydroxide ion concentration is more than 1000 times as large as the concentration of crystal violet, [OH -] will not change appreciably during this experiment. Thus, you will find the order with respect to crystal violet (m), but not the order with respect to hydroxide (n). As the reaction proceeds, a violet-colored reactant will be slowly changing to a colorless product. Using the green (565 nm) light source of a computer-interfaced colorimeter, you will monitor the absorbance of the crystal violet solution with time. We will assume that absorbance is proportional to the concentration of crystal violet (Beer’s law). Absorbance will be used in place of concentration in plotting the following three graphs: • Absorbance vs. time: • ln Absorbance vs. time: • 1/Absorbance vs. time: A linear plot indicates a zero order reaction (k = –slope). A linear plot indicates a first order reaction (k = –slope). A linear plot indicates a second order reaction (k = slope). Once the order with respect to crystal violet has been determined, you will also be finding the rate constant, k, and the half-life for this reaction. Equipment: Vernier colorimeter, LabPro Interface, graphing calculator, plastic cuvette, 250 mL beaker, 2 x 10 mL graduated cylinders, stir rod Materials: 0.020M NaOH, 2.0 x 10⁻⁵M crystal violet, distilled water Safety: 1) crystal violet will permanently stain skin and clothing 2) sodium hydroxide is caustic and will burn skin and permanently damage eyes. Procedure: 1. Using the 10 mL graduated cylinders, obtain 10.0 mL each of the crystal violet and sodium hydroxide solutions. 2. Make sure the colorimeter is plugged into one of the 4 channels of the LabPro Interface. Make sure the LabPro is plugged in and turned on. Make sure the graphing calculator is properly linked with the Lab Pro. 3. In the “Apps” menu on the calculator, select the “DataMate” program. Once the main screen has come on, set up the experiment as follows: (1) Setup – make sure one of the channels shows “colorimeter” - scroll down to the “mode” line and select by hitting “Enter” - select (2) “time graph”, and then select (2) “change time settings” - enter “5” for number of seconds between samples - enter “120” for number of samples - make sure the display has “5” “120” and “600” and select (1) “OK” if they are correct. - select (1) “OK” to return to the main screen. * Calibrating your colorimeter. Rinse a cuvette with distilled water, making sure to only handle it on the top, only touching the non-optical sides of the vial. After a couple of rinses, fill the cuvette about 2/3 full of water and gently place it in the colorimeter (don’t let it splash!) so that the optical surface matches up with the path of the light (north-south). Make sure the colorimeter is set to green (565 nm) for this experiment. Press the “CAL” button on the colorimeter to calibrate. A red light on the colorimeter should blink a few times. When the light is done blinking, check the display on the calculator to verify that the colorimeter is reading “0” on the top right of the display. If not, you will need to re-zero the colorimeter. Select “Setup” (1), and select re-zero (3), and follow the instructions. Once the colorimeter is re-zeroed, repeat the calibration step. 4. When you are ready to proceed, simultaneously pour the crystal violet solution and the NaOH into the beaker and swirl the beaker a few times to mix the solutions. Let it sit for about 3 minutes while you prepare to collect data. 5. Once the calulator and colorimeter are ready, rinse the cuvette a few times with the crystal violet solution, and then fill the cuvette about 2/3 full of the solution. Place the cuvette into the colorimeter, close the lid, and wait until the absorbance reading is steady (It will increase for a few seconds, then steadily decrease). Press “Start” (2) on the main screen of the calculator. You should hear a beeping signal from the Lab Pro. 6. Leave the apparatus undisturbed for 10 minutes (do you have any homework to do?). The setup is collecting absorbance data every 5 seconds for the 10 minute period. Once the data collection is complete, you will hear a beeping signal from the LabPro. You should see a re-scaled graph of your data on the screen. Press “Enter” to return to the main screen. 7. To analyze your data, you need to determine the order of your reaction. Press “Quit” (6) to exit Data Mate. The calculator will put your data in lists. Time will be in list 1 (L1), and absorbance will be L2. If your original graph looked linear (time vs. abs), then the reaction is zero order. In the Analyze (4) menu, select “Curve Fit” (2), and select “Ch.1 vs. time” (1). This will calculate a linear regression formula. Make sure to record the slope (A), y-intercept (B), and the correlation value (R). R needs to be very close to 1 for this to be accepted as a linear equation. 8. We want to make L3 contain the natural log of your absorbance data. Press “ln” “2 nd” “L2” (number 2) “STO>” “L3”, and then hit “Enter”. This will calculate the natural logs of all the absorbances in list 2 and place them into list 3. 9. We also want to make L4 contain the 1/abs data. Press “1” “/” “L2” “STO>” “L4”, and then hit “Enter”. This will calculate the reciprocals of all the absorbances in list 2 and place them into list 3. 10. To look at your data, press “STAT”, and then select edit. Press “2 nd” “QUIT” to clear out of that screen. 11. You need to determine which of your three sets of data produce the best linear equation. If your reaction is not zero order, you need to look at the natural log (L3) and the reciprocal (L4) graphs. Hit “2nd” “STAT PLOT” to get the statplot screen. Select “ON”, type scatter (dots), “Xlist L1”, “Ylist L3”, and whatever marks you see fit. Press “GRAPH” to see your graph. If you can’t see your data, change the parameters using the “WINDOW” key so your graph is nice and visible. If this graph is linear, your reaction is first order, and you will need to calculate a linear regression. If not, change the “Ylist” to L4 to see how that graph looks. If this graph is linear, your reaction is 2nd order. 12. To calculate a linear regression, press “STAT”, scroll over to “CALC”, and select “LinReg (ax+b)” (4). Then enter “L1” “,” and enter the other list (L2, L3, or L4) which produced the most linear data. The calculator will display the slope (a), and y-intercept(b). Be sure to record these values. Download your data to a computer and print your linear graph and all of your data in one table. Calculations: 1. Was the reaction zero, first, or second order, with respect to the concentration of crystal violet? Explain. 2. Calculate the rate constant, k, using the slope of the linear regression line for your linear curve (k = –slope for zero and first order and k = slope for second order). Be sure to include correct units for the rate constant. Note: This constant is sometimes referred to as the pseudo rate constant, because it does not take into account the effect of the other reactant, OH-. 3. Write the correct rate law expression for the reaction, in terms of crystal violet (omit OH -). 4. Using the printed data table, estimate the half-life of the reaction; select two points, one with an absorbance value that is about half of the other absorbance value. The time it takes the absorbance (or concentration) to be halved is known the half-life for the reaction. (As an alternative, you may choose to calculate the half-life from the rate constant, k, using the appropriate concentration-time formula.)

