35 Rate Determination and Activation Energy
advertisement
Calculator
Rate Determination
and Activation Energy
35
An important part of the kinetic analysis of a chemical reaction is to determine the activation
energy, Ea. Activation energy can be defined as the energy necessary to initiate an otherwise
spontaneous chemical reaction so that it will continue to react without the need for additional
energy. An example of activation energy is the combustion of paper. The reaction of cellulose
and oxygen is spontaneous, but you need to initiate the combustion by adding activation energy
from a lit match.
In this experiment you will investigate the reaction of crystal violet with sodium hydroxide.
Crystal violet, in aqueous solution, is often used as an indicator in biochemical testing. The
reaction of this organic molecule with sodium hydroxide can be simplified by abbreviating the
chemical formula for crystal violet as CV.
CV+ (aq) + OH– (aq) → CVOH (aq)
As the reaction proceeds, the violet-colored CV+ reactant will slowly change to a colorless
product, following the typical behavior of an indicator. The color change will be precisely
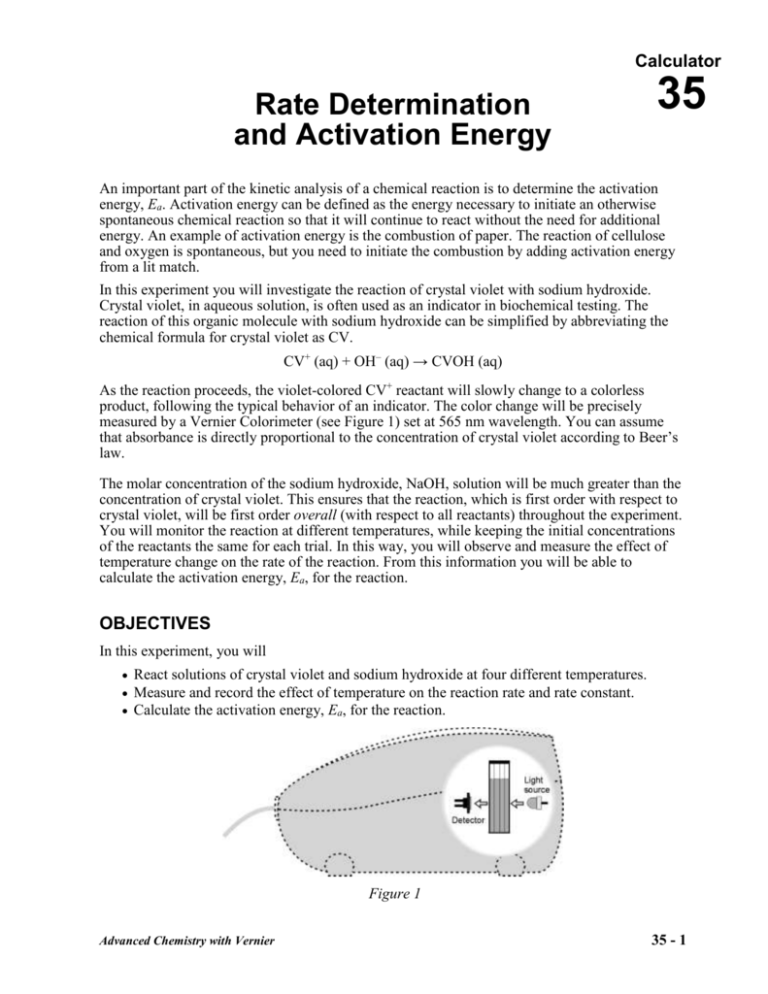
measured by a Vernier Colorimeter (see Figure 1) set at 565 nm wavelength. You can assume
that absorbance is directly proportional to the concentration of crystal violet according to Beer’s
law.
The molar concentration of the sodium hydroxide, NaOH, solution will be much greater than the
concentration of crystal violet. This ensures that the reaction, which is first order with respect to
crystal violet, will be first order overall (with respect to all reactants) throughout the experiment.
You will monitor the reaction at different temperatures, while keeping the initial concentrations
of the reactants the same for each trial. In this way, you will observe and measure the effect of
temperature change on the rate of the reaction. From this information you will be able to
calculate the activation energy, Ea, for the reaction.
OBJECTIVES
In this experiment, you will
React solutions of crystal violet and sodium hydroxide at four different temperatures.
Measure and record the effect of temperature on the reaction rate and rate constant.
Calculate the activation energy, Ea, for the reaction.
Figure 1
Advanced Chemistry with Vernier
35 - 1
Calculator 35
MATERIALS
LabPro or CBL 2 interface
TI graphing calculator
Vernier Colorimeter
Temperature Probe
5 plastic cuvettes
0.10 M NaOH solution
2.5 × 10⁻⁵ M crystal violet solution
1 liter beaker
ice
two 10 mL graduated cylinders
two 100 mL beakers
50 mL beaker
watch with a second hand
PROCEDURE
1. Obtain and wear goggles.
2. Connect a Colorimeter to Channel 1 of the LabPro or CBL 2 interface. Connect a
Temperature Probe to Channel 3. Use the link cable to connect the interface to the TI
graphing calculator.
3. Set up the calculator and interface for the Colorimeter and Temperature Probe.
a. Turn on the calculator and start the DATAMATE program. Press CLEAR to reset the program.
b. Select SETUP from the Main screen. If CH 1 displays COLORIMETER IN CH1 and STAINLESS
TEMP (C) IN CH3 , proceed to Step 4. If it does not, continue with Step c to set up the
sensor manually.
c. Press ENTER to select CH 1.
d. Choose COLORIMETER from the list of sensors.
e. Press
twice, then press ENTER to select CH3.
f. Select the Temperature Probe you are using (in °C) from the TEMPERATURE menu.
4. Set up the data collection mode.
a. To select MODE, press
until the cursor is to the left of MODE and press ENTER .
b. Select TIME GRAPH from the SELECT MODE menu.
c. Select CHANGE TIME SETTINGS. Type “3”, for the time between samples in seconds, and
then press ENTER . Type “20” for the number of samples, and then press ENTER .
d. Select OK twice to return to the Main screen.
5. Calibrate the Colorimeter. Note: You will use this calibration for all four trials in this
experiment. Follow these steps to calibrate the Colorimeter.
a. Prepare a blank by filling an empty cuvette ¾ full with distilled water. Place the blank in
the cuvette slot of the Colorimeter and close the lid.
b. If your Colorimeter has a CAL button, set the wavelength on the Colorimeter to 565 nm,
press the CAL button, and proceed directly to Step 6. If your Colorimeter does not have a
CAL button, continue with this step to calibrate your Colorimeter.
c. Select SETUP from the Main screen.
d. Press ENTER to select CH 1.
e. Select CALIBRATE from the SETUP menu.
f. Select CALIBRATE NOW from the CALIBRATION menu.
g. Turn the wavelength knob of the Colorimeter to the 0% T position. When the voltage
reading stabilizes, press ENTER . Enter “0” as the percent transmittance.
35 - 2
Advanced Chemistry with Vernier
Rate Determination and Activation Energy
h. Turn the wavelength knob on the Colorimeter to 565 nm (Green). When the voltage
reading stabilizes, press ENTER . Enter “100” as the percent transmittance.
i. Select OK twice to return to the Main screen.
6. Prepare a cool-water bath, ~10°C, in a 1 liter beaker. The bath can be shallow because you
will be using it to cool the two 10.0 mL aliquots of reactants. Immerse the tip of a
Temperature Probe in the cool-water bath.
7. Ready the NaOH and crystal violet solutions for the first trial.
a. Use a 10 mL graduated cylinder to obtain 10.0 mL of 0.10 M NaOH solution. Transfer the
solution to a 100 mL beaker. CAUTION: Sodium hydroxide solution is caustic. Avoid
spilling it on your skin or clothing.
b. Use another 10 mL graduated cylinder to obtain 10.0 mL of 2.5 × 10⁻⁵ M crystal violet
solution. Transfer the solution to a second 100 mL beaker. CAUTION: Crystal violet is a
biological stain. Avoid spilling it on your skin or clothing.
c. Place the two 100 mL beakers of reactants in the water bath. Make sure that the level of
the solutions on the beakers is below the level of the water bath. The beakers should be in
this water bath for at least one minute.
8. Conduct the first trial. Be ready to time the reaction.
a. Check the temperature of the water bath; it should be holding steady at or near 10°C.
b. When you are certain that the reactants have been cooled to ~10°C, pour the NaOH and
crystal violet solutions into the 50 mL beaker. Start timing the reaction using the second
hand on your watch. You will allow the reaction to run for one minute before proceeding
to Part c of this step. Gently stir the reaction mixture with the Temperature Probe.
c. After one minute, record the temperature of the mixture (displayed on the Main screen).
d. Fill a clean, dry cuvette about ¾ full with the reaction mixture. Place the cuvette in the
Colorimeter. Close the lid on the Colorimeter.
e. Select START from the Main screen to begin the data collection.
f. Data will be collected for 60 seconds. Observe the progress of the reaction in the beaker.
g. When data collection is complete, carefully remove the cuvette from the Colorimeter.
Dispose of the contents of the beaker and cuvette as directed.
h. To view a graph of absorbance vs. time, select CH1-ABSORBANCE.
9. Because the reaction is first order with respect to crystal violet, you can determine the rate
constant, k, by plotting a graph of ln absorbance vs. time. Press ENTER , then return to the Main
screen and quit the DataMate program. Follow the directions in this step for your calculator,
then proceed to Step 10.
TI-73, TI-83, TI-83 Plus, TI-84 Plus Calculators
a. To view the lists, press STAT , then select Edit. On a TI-73, press LIST .
b. To create a list of natural log (ln) of absorbance values in L3, move the cursor up and to
2nd
the right until the L3 heading is highlighted, then press LN
[L2] ENTER . Proceed to
Step 10
TI-86 Calculators
a. To view the lists, press 2nd [STAT] and select <EDIT>.
b. To create a list of natural log (ln) of absorbance values in L3, move the cursor up and to
the right until the L3 heading is highlighted, then press LN <NAMES> <L1> ENTER .
c. Press 2nd [QUIT] when you are finished with this step, then proceed to Step 10.
Advanced Chemistry with Vernier
35 - 3
Calculator 35
TI-89 Calculators
a. Press APPS , then select Home.
b. To create a list of natural log (ln) of absorbance values in L 3, press CLEAR
)
ALPHA [L]
ALPHA [L]
ENTER . Proceed to Step 10.
STO
2
3
2nd
[LN]
TI-92, TI-92 Plus, and Voyage Calculators
a. Press APPS , then select Home.
b. To create a list of natural log (ln) of absorbance values in L 3, press
ENTER .
STO
2
L
3
CLEAR
LN
L
10. Follow this procedure to calculate regression statistics and to plot a best-fit regression line on
your graph of ln absorbance vs. time:
a.
b.
c.
d.
Restart the DATAMATE program.
Select ANALYZE from the main screen.
Select CURVE FIT from the ANALYZE OPTIONS menu.
Select LINEAR (CH 2 VS TIME) from the CURVE FIT menu (CH2, or L 3, is ln absorbance).
From the slope value, m (displayed as A on the calculator), determine the rate constant, k,
and record it in your data table.
e. Press ENTER to see the linear regression plotted with your data.
f. Press ENTER to return to the ANALYZE OPTIONS screen. Select RETURN TO MAIN SCREEN.
11. Repeat Steps 7-10, using a water bath at ~15°C. Prepare this water bath by adding warm
water to the 1 liter beaker.
12. Repeat Steps 7-10, using a water bath at ~20°C.
13. Repeat Steps 7-10, using a water bath at ~25°C.
DATA TABLE
Trial
Temperature
(°C)
Rate constant, k
(s-1)
1
2
3
4
35 - 4
Advanced Chemistry with Vernier
Rate Determination and Activation Energy
DATA ANALYSIS
The Arrhenius equation describes the relationship between rate constant and absolute
temperature:
ln k = Ea / RT + B
where ln k is the natural logarithm of the rate constant, k, Ea is the activation energy, R is the gas
constant, T is the absolute temperature, and B is a positive constant. If this equation is rearranged
in slope-intercept form (y = mx + b):
1
ln k = Ea / R • T + B
the slope, m, should be equal to -Ea / R. If a plot of ln P vs. 1/T is made, the activation energy can
be determined from the slope of the curve. Plot the graph on the TI calculator:
1. Enter the temperature (°C) and rate constant values into your calculator:
TI-73 Calculators
a.
b.
c.
d.
To view the data lists, press LIST .
Clear L1 and L 2 by moving the cursor to the L1 or L 2 headings and pressing CLEAR ENTER .
Enter the four Celsius temperature values in L1 and the four corresponding k values in L 2.
To create a list of reciprocal of Kelvin temperature values (in L 3), move the cursor until
2nd
STAT
the L3 column heading is highlighted, then press (
[L1] + 273 )
-1 ENTER
2nd
[X ]
.
e. To create a list of natural log (ln) of k values (in L 2), move the cursor until the L2 column
heading is highlighted, press MATH
and select [ln(] from the log menu.
Then press 2nd STAT [L 2] ENTER . Proceed to Step 2.
TI-83, TI-83 Plus, and TI-84 Plus Calculators
a. To view the data lists, press STAT to display the EDIT menu, and select Edit.
b. Clear L1 and L 2 by moving the cursor to the L1 heading and pressing CLEAR ENTER . Do the
same for the L 2 list.
c. Enter the four Celsius temperature values in L1 and the four corresponding k values in L 2.
d. To create a list of reciprocal of Kelvin temperature values (in L 3), move the cursor to the
(
2nd
ENTER .
x –1
L3 column heading, then press
[L1] + 273 )
e. To create a list of natural log (ln) of k values (in L 2), move the cursor to the L2 column
2nd
heading, then press LN
[L 2] ENTER . Proceed to Step 2.
TI-86 Calculators
a. To view the data lists, press 2nd [STAT], then select < EDIT>.
b. Clear any previous data from lists L1 and L 2 — move the cursor to the L1 heading and press
CLEAR , then ENTER . Do the same for the L 2 list.
c. Enter the four temperature values in L1 and the four corresponding k values in L 2.
d. To create a list of reciprocal of Kelvin temperature values (in L 3), move the cursor until
the L3 column heading is highlighted, then select <NAMES>. Press ( <L1> + 273
)
2nd
[x–1] ENTER .
e. To create a list of natural log (ln) of k values (in L 2), move the cursor until the L 2 heading
is highlighted, then press LN <L 2> ENTER . Press 2nd [QUIT]. Proceed to Step 2.
TI-89 Calculators
a. Press
APPS
, then select Home.
Advanced Chemistry with Vernier
35 - 5
Calculator 35
b. Enter the four Celsius temperature values in L1 and the four corresponding k values in L 2.
First, enter the temperature values (shown here as t1, t2, ...) into L1. To do this, press
CLEAR
2nd
ENTER .
[{] t1 , t2 , t3 , t4 2nd [}] STO ALPHA [L] 1
c. Now enter the four corresponding k values (shown here as p1, p2, ...) into L2. Press CLEAR
2nd
ENTER .
[{] p1 , p2 , p3 , p4 2nd [}] STO ALPHA [L] 2
1
d. To create a list of reciprocal of Kelvin temperature values (in L 3), press CLEAR
(
ALPHA [L]
ALPHA [L]
ENTER .
STO
1
3
+ 273 )
e. To create a list of natural log (ln) of k values (in L2), press CLEAR LN ALPHA [L] 2
)
ALPHA [L]
ENTER . Proceed to Step 2.
STO
2
TI-92, TI-92 Plus, and Voyage Calculators
a. Press APPS , then select Home.
b. Enter the four Celsius temperature values in L1 and the four corresponding k values in L 2.
First, enter the temperature values (shown here as t1, t2, ...) into L1. To do this, press
CLEAR
2nd
ENTER .
L
1
[{] t1 , t2 , t3 , t4 2nd [}] STO
c. Now enter the four corresponding k values (shown here as p1, p2, ...) into L2. Press CLEAR
2nd
ENTER .
L
2
[{] p1 , p2 , p3 , p4 2nd [}] STO
1
d. To create a list of reciprocal of Kelvin temperature values (in L 3), press CLEAR
(
ENTER .
STO
L
1
L
3
+ 273 )
L
2
e. To create a list of natural log (ln) of k values (in L2), press CLEAR LN
)
ENTER . Proceed to Step 2.
STO
L
2
2. Follow this procedure to calculate regression statistics and to plot a best-fit regression line on
your graph of ln rate constant vs. reciprocal of Kelvin temperature.
a. Start the DATAMATE program.
b. Select ANALYZE from the main screen.
c. Select CURVE FIT from the ANALYZE OPTIONS menu.
Select LINEAR (CH1 VS CH2) from the CURVE FIT menu (CH1, or L 2, is ln k and CH2, or L 3,
is 1/Kelvin temperature). Record the value of the slope, m (displayed as A on the
calculator), to use in calculating the activation energy in Step 3.
d. To display the linear-regression curve on the graph of ln k vs. 1/Kelvin temperature,
press ENTER .
3. Use the slope, m, of the linear fit you recorded in Step 2 to calculate the activation energy,
Ea, in units of kJ/mol. Note: On a plot of ln k vs. 1/absolute temperature, Ea = m × R.
4. A well-known approximation in chemistry states that the rate of a reaction often doubles for
every 10°C increase in temperature. Use your data to test this rule. Calculate the ratio of the
rate constant at ~20°C to the rate constant at ~10°C. Then calculate the ratio of the rate
constant at ~25°C to the rate constant at ~15°C. How close were these values to a ratio of 2?
(Note: It is not necessarily equal to 2.00; this is just an approximate value, and depends on
the activation energy for the reaction.)
5. Using the rate constant and precise temperature value for the trial that was done at room
temperature (~20°C), as well as the Ea value you obtained in Step 3 above, calculate what the
rate constant would be at 40°C.
35 - 6
Advanced Chemistry with Vernier

