File - MHS
advertisement
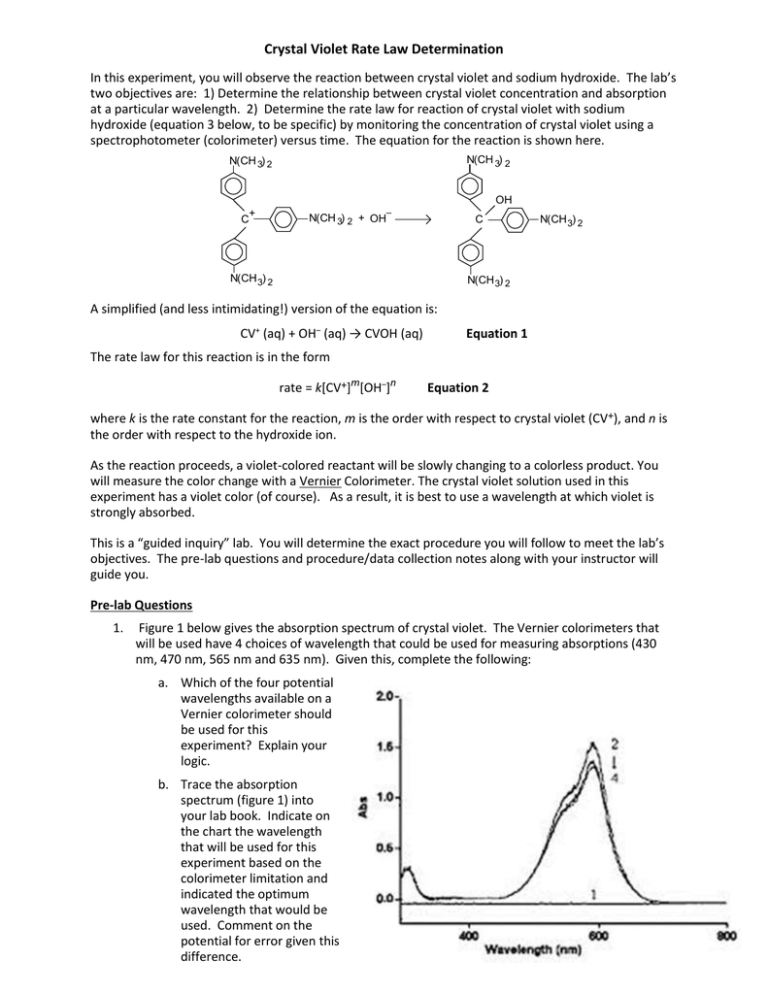
Crystal Violet Rate Law Determination In this experiment, you will observe the reaction between crystal violet and sodium hydroxide. The lab’s two objectives are: 1) Determine the relationship between crystal violet concentration and absorption at a particular wavelength. 2) Determine the rate law for reaction of crystal violet with sodium hydroxide (equation 3 below, to be specific) by monitoring the concentration of crystal violet using a spectrophotometer (colorimeter) versus time. The equation for the reaction is shown here. N(CH 3) 2 N(CH 3) 2 OH + C – N(CH 3) 2 + OH C N(CH 3) 2 2 N(CH 3) 2 N(CH 3) 2 A simplified (and less intimidating!) version of the equation is: CV+ (aq) + OH– (aq) → CVOH (aq) Equation 1 The rate law for this reaction is in the form rate = k[CV+]m[OH–]n Equation 2 where k is the rate constant for the reaction, m is the order with respect to crystal violet (CV+), and n is the order with respect to the hydroxide ion. As the reaction proceeds, a violet-colored reactant will be slowly changing to a colorless product. You will measure the color change with a Vernier Colorimeter. The crystal violet solution used in this experiment has a violet color (of course). As a result, it is best to use a wavelength at which violet is strongly absorbed. This is a “guided inquiry” lab. You will determine the exact procedure you will follow to meet the lab’s objectives. The pre-lab questions and procedure/data collection notes along with your instructor will guide you. Pre-lab Questions 1. Figure 1 below gives the absorption spectrum of crystal violet. The Vernier colorimeters that will be used have 4 choices of wavelength that could be used for measuring absorptions (430 nm, 470 nm, 565 nm and 635 nm). Given this, complete the following: a. Which of the four potential wavelengths available on a Vernier colorimeter should be used for this experiment? Explain your logic. b. Trace the absorption spectrum (figure 1) into your lab book. Indicate on the chart the wavelength that will be used for this experiment based on the colorimeter limitation and indicated the optimum wavelength that would be used. Comment on the potential for error given this difference. 2. A calibration curve requires preparation of a set of known concentrations of CV which are usually prepared by diluting a stock solutions with a known concentration. a. Describe how to prepare a 5, 10, 15 and 20 M CV starting with a 25 m CV stock solution. b. Build a data table to capture the absorption vs concentration of the dilutions prepared. (Populate this data table in put in the results section of your lab report.) 3. The equation on the previous page suggests that CV and OH- react in a 1:1 mole ratio. In trial 1, the concentrations of CV and OH- are equal; however, in trial 2 the concentration of OH- is 1000 times that of CV. a. What percentage change in [OH-] might we expect in trial 1 and what percentage change might we expect in trial 2? b. Under certain experimental conditions, equation 2 given on the previous page simplifies: rate = k*[CV+]m Equation 3 where k* = k[OH-]n Equation 4 Using your answer from part a, why can equation 3 be used for an experiment where [OH-] is many orders of magnitude higher than [CV]? c. 4. Assuming that the stock solution of CV is 25 M CV, what concentration of NaOH will you use to determine the simplified rate law given in equation 3? Early on in a reaction, zero, 1st and 2nd order reactions may all appear to have concentration drop linearly with time. Based on the data to the right, to roughly what % of the original concentration must the reactants drop to ensure the rate order is clear? Hint: the [CV] does NOT need to be essentially zero to determine reaction order. PROCEDURE/DATA COLLECTION NOTES Each lab team must create their own detailed procedure for this lab. The following information is provided as guidance Calibration Curve To begin, you will determine the linear relationship between Crystal Violet absorbance and concentration. A = abc, where A is absorbance as measured by the colorimeter, b is the path length in the cuvette (1 cm) and c is the concentration of crystal violet. You may then use this linear relationship to determine change in concentration vs time in experiments in which crystal violet is added to NaOH as suggested above. In other words, you will experimentally determine “a” the absorptivity constant. NOTE: In determining the molar absorptivity constant (“a”), you should either determine “a” at each concentration and average the values or force the curve fit of the data through zero. (Otherwise, at very low concentrations, your calculated concentrations may “blow up” at low concentrations. Talk to your instructor if you have questions.) Kinetics Experiment While you will use the calibration curve you determine experimentally (see above) to determine the concentrations of crystal violet vs time, you will measure absorbance during the reaction to monitor the change in concentration vs time. Absorbance is proportional to the concentration of crystal violet (Beer’s law). While absorbance will be measured experimentally the following graphs and data dabbles which must appear in your lab report: absorbance vs time (raw data) Concentration vs. time: A linear plot indicates a zero order reaction (k = –slope). ln [concentration] vs. time: A linear plot indicates a first order reaction (k = –slope). 1/[concentration] vs. time: A linear plot indicates a second order reaction (k = slope). Refer to “Including Data and Graphs in your Lab Reports” at the front of the lab books for further helpful hints on what to do to earn full credit. BONUS OPTION Design an additional experiment to determine from equations 2 and 4, a) n, the order with respect to NaOH and b) k, the rate constant Lab Quest Data Collection & Procedural Suggestions 1. To set up your Lab Quest so that you can collect absorbance data vs time, set up the data-collection mode. a. On the Meter screen, tap Rate. Change the data-collection rate to 1 sample/second. b. Change the data-collection length to 500 seconds. Select OK. 2. Remember to calibrate your colorimeter with deionized water prior to beginning each lab period. 3. Quickly mix your NaOH and CV solution. Rinse the cuvette twice with ~1 mL amounts of the reaction mixture, fill it 3/4 full, and place it in the Colorimeter. Close the lid on the Colorimeter. Start data collection (press the green arrow button in the bottom left corner of the LabQuest2). 4. Absorbance data will be collected for 500 seconds. You may stop data collection early if desired. Rinse the beaker and the cuvette. Please place these in a wash basin at the end of lab. 4. Download the data. Option 1 – Download directly to a flashdrive. Go to the “File” menu on your LabQuest. Click save as “text”. This file can then be opened in Excel or other spreadsheet program by handling it as a comma separated (CSV) file. Once this is done, plots and data should be saved as EXCEL files. Option 2 – Connect LabQuest to one of the classroom computers using the cable in the box. E-mail the CSV file to yourself (see above) OR save as a Logger Pro file and manipulate it at home. You may download Logger Pro under the MHS site license using the links below: Logger Pro 3.8.6.2 with sample movies (Windows) Link: http://www.vernier.com/d/1t8hl Password – provided by your instructor Logger Pro 3.8.6.2 with sample movies (Mac OS X) Link: http://www.vernier.com/d/agnk8 Password – provided by your instructor Post Lab Questions: 1. What is the molar absorptivity constant “a” for crystal violet? 2. Why would starting with 75 m CV concentration have adversely impacted the accuracy of the early measurements? 3. What is the rate law of crystal violet if [OH-] is held constant? (See equation 3.) Include the value for k* and how you determined it. (Repeat as question 1a, if you conducted the bonus exercise, but determine the rate law of equation 2.) 4. What is the half life of crystal violet in your experiment? How would this half life have changed if the initial crystal violet concentration had been higher? 5. A student neglected to rinse the cuvette with the solution being studied. If the cuvette had been used to calibrate the colorimeter immediately prior, how would this change the absorbance measurement and how might that impact rate of reaction calculations? REFERENCES The College Board. AP Chemistry Guided Inquiry Experiments: Applying the Science Practices. 2013. Holmquist, Dan D., et. Al, Chemistry with Vernier, Oregon, Vernier Sortware & Technology, 2007.

