Immigrant Count versus Immigrant Density
advertisement
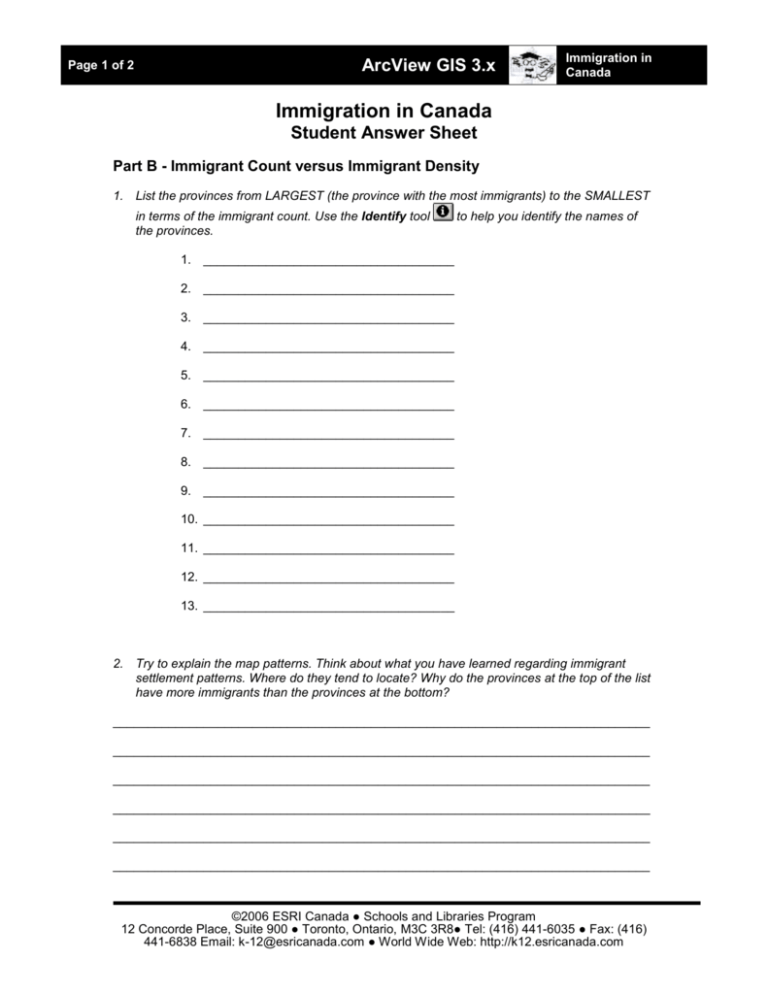
Page 1 of 2 ArcView GIS 3.x Immigration in Canada Immigration in Canada Student Answer Sheet Part B - Immigrant Count versus Immigrant Density 1. List the provinces from LARGEST (the province with the most immigrants) to the SMALLEST in terms of the immigrant count. Use the Identify tool the provinces. to help you identify the names of 1. ____________________________________ 2. ____________________________________ 3. ____________________________________ 4. ____________________________________ 5. ____________________________________ 6. ____________________________________ 7. ____________________________________ 8. ____________________________________ 9. ____________________________________ 10. ____________________________________ 11. ____________________________________ 12. ____________________________________ 13. ____________________________________ 2. Try to explain the map patterns. Think about what you have learned regarding immigrant settlement patterns. Where do they tend to locate? Why do the provinces at the top of the list have more immigrants than the provinces at the bottom? _____________________________________________________________________________ _____________________________________________________________________________ _____________________________________________________________________________ _____________________________________________________________________________ _____________________________________________________________________________ _____________________________________________________________________________ ©2006 ESRI Canada ● Schools and Libraries Program 12 Concorde Place, Suite 900 ● Toronto, Ontario, M3C 3R8● Tel: (416) 441-6035 ● Fax: (416) 441-6838 Email: k-12@esricanada.com ● World Wide Web: http://k12.esricanada.com ArcView GIS 3.x Page 2 of 2 Immigration in Canada 3. Is there a difference between the two maps? Turn the visibility of each theme on to help you see each theme clearly. Describe what you see. or off _____________________________________________________________________________ _____________________________________________________________________________ _____________________________________________________________________________ _____________________________________________________________________________ _____________________________________________________________________________ _____________________________________________________________________________ 4. Why do you think that there are so many classes with zero values in the Immigrant Density (# of ppl/sq. KM) theme? Hint: go back to the Legend Editor, click the Classify button and look at Round values at. What happens if you change Round Values at to d.dddddd? _____________________________________________________________________________ _____________________________________________________________________________ _____________________________________________________________________________ _____________________________________________________________________________ _____________________________________________________________________________ _____________________________________________________________________________ Report your Findings In a report, make comparisons between the proportion of immigrants from the 5 specified countries in the different provinces/territories. For your report, do some research or use existing knowledge to explain the distribution of immigrants in Canada. What are the factors influencing immigrant settlement patterns (e.g., geography, language, political, climate etc.) Why are there such a high proportion of Ukrainian immigrants in Manitoba and Saskatchewan? Do some research if necessary. What country of origin do most provinces have as their top source of immigrants? Does this surprise you? What region of Canada appears to have the highest proportion of Irish immigrants and why might this be? Explain the overwhelming proportion of Haitian and French immigrants to Quebec. Discuss challenges and opportunities that lead people to immigrate to Canada. Why is the data in the northern territories (Yukon Territory, Northwest Territory, and Nunavut) not necessarily representative/slightly skewed. ©2006 ESRI Canada ● Schools and Libraries Program 12 Concorde Place, Suite 900 ● Toronto, Ontario, M3C 3R8● Tel: (416) 441-6035 ● Fax: (416) 441-6838 Email: k-12@esricanada.com ● World Wide Web: http://k12.esricanada.com

