Stress Strain Lab
advertisement
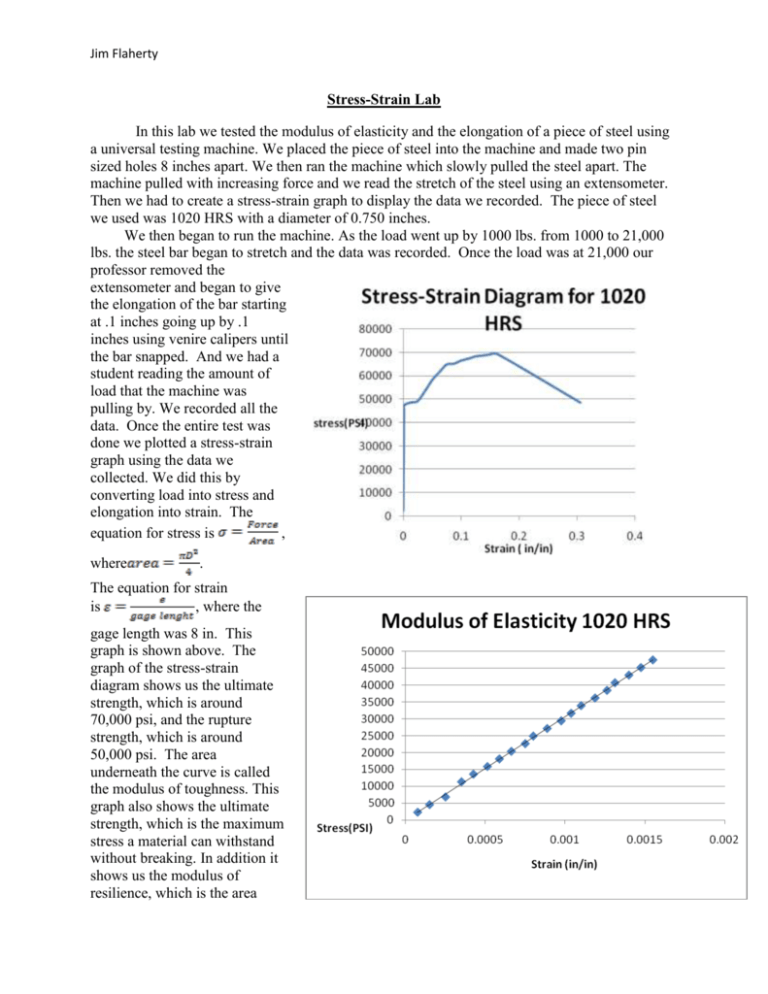
Jim Flaherty Stress-Strain Lab In this lab we tested the modulus of elasticity and the elongation of a piece of steel using a universal testing machine. We placed the piece of steel into the machine and made two pin sized holes 8 inches apart. We then ran the machine which slowly pulled the steel apart. The machine pulled with increasing force and we read the stretch of the steel using an extensometer. Then we had to create a stress-strain graph to display the data we recorded. The piece of steel we used was 1020 HRS with a diameter of 0.750 inches. We then began to run the machine. As the load went up by 1000 lbs. from 1000 to 21,000 lbs. the steel bar began to stretch and the data was recorded. Once the load was at 21,000 our professor removed the extensometer and began to give the elongation of the bar starting at .1 inches going up by .1 inches using venire calipers until the bar snapped. And we had a student reading the amount of load that the machine was pulling by. We recorded all the data. Once the entire test was done we plotted a stress-strain graph using the data we collected. We did this by converting load into stress and elongation into strain. The equation for stress is , where . The equation for strain is , where the gage length was 8 in. This graph is shown above. The graph of the stress-strain diagram shows us the ultimate strength, which is around 70,000 psi, and the rupture strength, which is around 50,000 psi. The area underneath the curve is called the modulus of toughness. This graph also shows the ultimate strength, which is the maximum stress a material can withstand without breaking. In addition it shows us the modulus of resilience, which is the area Jim Flaherty until the peak of yield. The yield strength is the area of the graph which rises strait up. Then we plotted a graph using only the set of data where the elongation only went up to .1 inches or up to the yield strength. This is the graph of the modulus of elasticity and is shown above. The modulus of elasticity also known as young’s modulus is the slop of the line. For 1020 HRS the modulus of elasticity is 30E6. The area underneath the curve is called the modulus of resilience. This line is linear because according to Hooke’s law a stress strain diagram the relationship is linear up to the yield point. The experiment was a success because the trend line of the data fits the data very well and the slope of the line is 30E6, which is the modulus of elasticity for 1020 HRS. We know this because we looked the information up to compare the data of out lab. The proportional limit is when the highest stress is still directly proportional to strain. The yield range is the strain that takes place up to the yield point.
