Loadlines - benchmark
advertisement
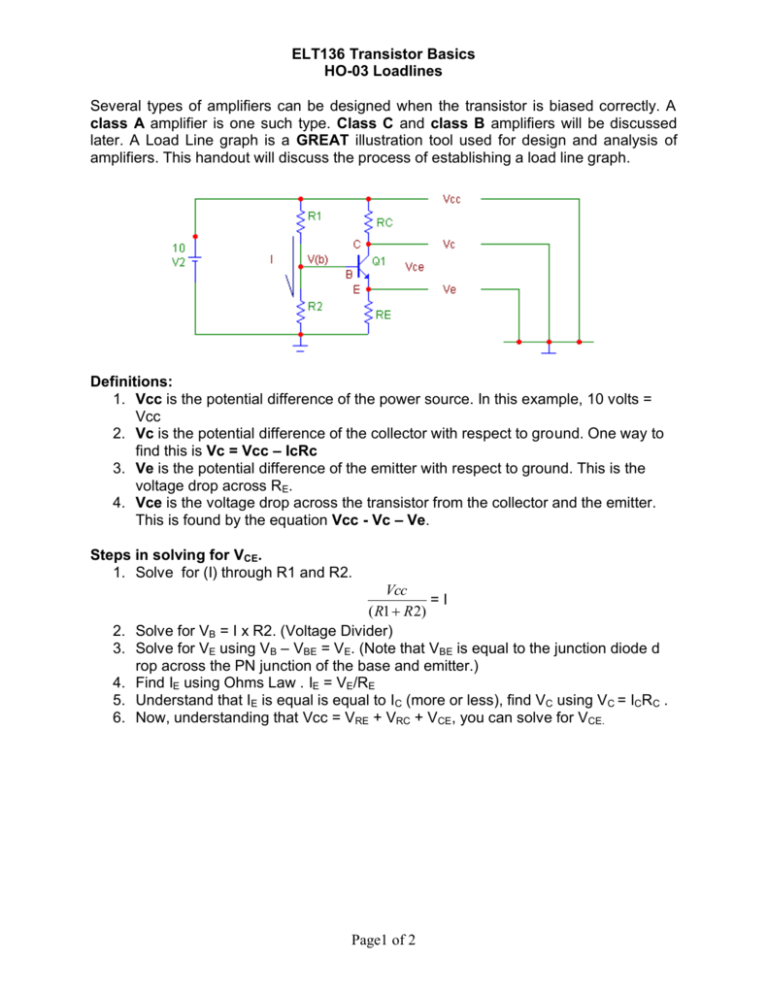
ELT136 Transistor Basics HO-03 Loadlines Several types of amplifiers can be designed when the transistor is biased correctly. A class A amplifier is one such type. Class C and class B amplifiers will be discussed later. A Load Line graph is a GREAT illustration tool used for design and analysis of amplifiers. This handout will discuss the process of establishing a load line graph. Definitions: 1. Vcc is the potential difference of the power source. In this example, 10 volts = Vcc 2. Vc is the potential difference of the collector with respect to ground. One way to find this is Vc = Vcc – IcRc 3. Ve is the potential difference of the emitter with respect to ground. This is the voltage drop across RE. 4. Vce is the voltage drop across the transistor from the collector and the emitter. This is found by the equation Vcc - Vc – Ve. Steps in solving for VCE. 1. Solve for (I) through R1 and R2. 2. 3. 4. 5. 6. Vcc =I ( R1 R 2) Solve for VB = I x R2. (Voltage Divider) Solve for VE using VB – VBE = VE. (Note that VBE is equal to the junction diode d rop across the PN junction of the base and emitter.) Find IE using Ohms Law . IE = VE/RE Understand that IE is equal is equal to IC (more or less), find VC using VC = ICRC . Now, understanding that Vcc = VRE + VRC + VCE, you can solve for VCE. Page1 of 2 ELT136 Transistor Basics HO-03 Loadlines A “Class A” amplifier is designed to bias the Q-point to a point on the load line that is midway between 0V and Vce(cutoff). IC Isat Q IB VCE Vcutoff Finding Saturation (When Vce = 0 volts). 1. The process is simple. Analyze the circuit when CE part of the transistor is represented as a short. Find the current through Rc and Re by taking: Vcc I ( sat ) ( Rc Re) note: when we apply RLoad things may change. Finding Cutoff (When Ic = 0 amps) 1. The process is also simple. Analyze the circuit when CE part of the transistor is represented as an open. In this circuit Vce(cutoff) is Vcc-V(Re). note: when we apply RLoad things may change. At this point, Ic(sat) and Vce(cutoff) can now be plotted on the load line graph and the load line drawn between them (see graph above). Page2 of 2
