2011 VCAA Scaling Report: ATAR & Study Scores
advertisement
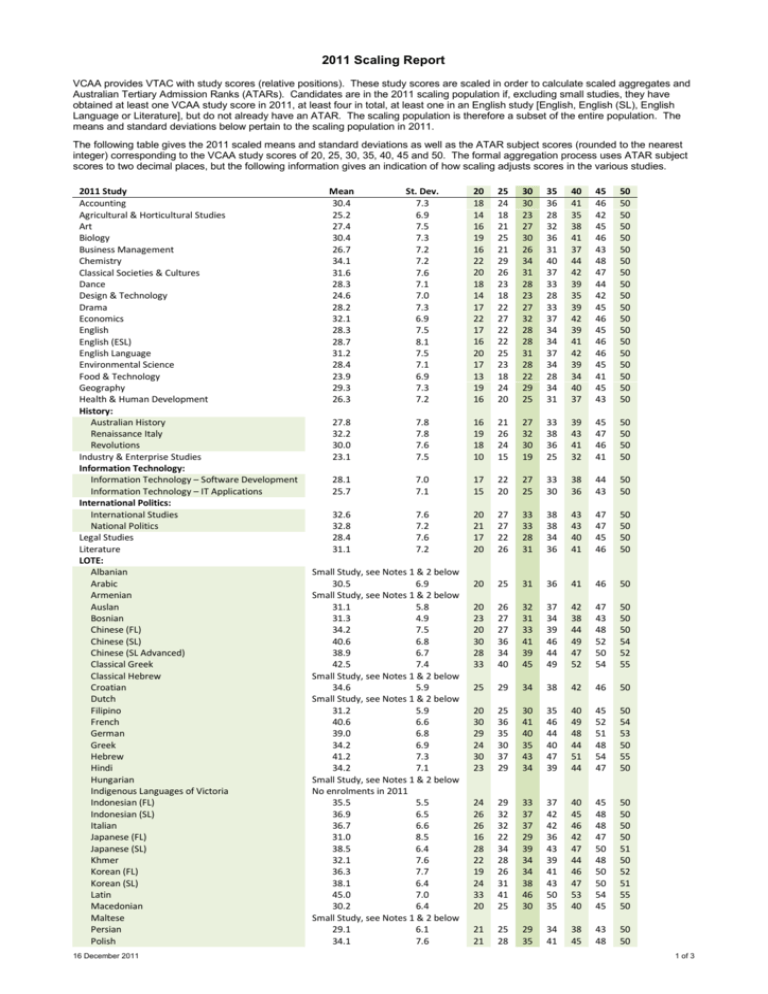
2011 Scaling Report VCAA provides VTAC with study scores (relative positions). These study scores are scaled in order to calculate scaled aggregates and Australian Tertiary Admission Ranks (ATARs). Candidates are in the 2011 scaling population if, excluding small studies, they have obtained at least one VCAA study score in 2011, at least four in total, at least one in an English study [English, English (SL), English Language or Literature], but do not already have an ATAR. The scaling population is therefore a subset of the entire population. The means and standard deviations below pertain to the scaling population in 2011. The following table gives the 2011 scaled means and standard deviations as well as the ATAR subject scores (rounded to the nearest integer) corresponding to the VCAA study scores of 20, 25, 30, 35, 40, 45 and 50. The formal aggregation process uses ATAR subject scores to two decimal places, but the following information gives an indication of how scaling adjusts scores in the various studies. 2011 Study Accounting Agricultural & Horticultural Studies Art Biology Business Management Chemistry Classical Societies & Cultures Dance Design & Technology Drama Economics English English (ESL) English Language Environmental Science Food & Technology Geography Health & Human Development History: Australian History Renaissance Italy Revolutions Industry & Enterprise Studies Information Technology: Information Technology – Software Development Information Technology – IT Applications International Politics: International Studies National Politics Legal Studies Literature LOTE: Albanian Arabic Armenian Auslan Bosnian Chinese (FL) Chinese (SL) Chinese (SL Advanced) Classical Greek Classical Hebrew Croatian Dutch Filipino French German Greek Hebrew Hindi Hungarian Indigenous Languages of Victoria Indonesian (FL) Indonesian (SL) Italian Japanese (FL) Japanese (SL) Khmer Korean (FL) Korean (SL) Latin Macedonian Maltese Persian Polish 16 December 2011 Mean 30.4 25.2 27.4 30.4 26.7 34.1 31.6 28.3 24.6 28.2 32.1 28.3 28.7 31.2 28.4 23.9 29.3 26.3 St. Dev. 7.3 6.9 7.5 7.3 7.2 7.2 7.6 7.1 7.0 7.3 6.9 7.5 8.1 7.5 7.1 6.9 7.3 7.2 20 18 14 16 19 16 22 20 18 14 17 22 17 16 20 17 13 19 16 25 24 18 21 25 21 29 26 23 18 22 27 22 22 25 23 18 24 20 30 30 23 27 30 26 34 31 28 23 27 32 28 28 31 28 22 29 25 35 36 28 32 36 31 40 37 33 28 33 37 34 34 37 34 28 34 31 40 41 35 38 41 37 44 42 39 35 39 42 39 41 42 39 34 40 37 45 46 42 45 46 43 48 47 44 42 45 46 45 46 46 45 41 45 43 50 50 50 50 50 50 50 50 50 50 50 50 50 50 50 50 50 50 50 27.8 32.2 30.0 23.1 7.8 7.8 7.6 7.5 16 19 18 10 21 26 24 15 27 32 30 19 33 38 36 25 39 43 41 32 45 47 46 41 50 50 50 50 28.1 25.7 7.0 7.1 17 15 22 20 27 25 33 30 38 36 44 43 50 50 32.6 32.8 28.4 31.1 7.6 7.2 7.6 7.2 20 21 17 20 27 27 22 26 33 33 28 31 38 38 34 36 43 43 40 41 47 47 45 46 50 50 50 50 20 25 31 36 41 46 50 20 23 20 30 28 33 26 27 27 36 34 40 32 31 33 41 39 45 37 34 39 46 44 49 42 38 44 49 47 52 47 43 48 52 50 54 50 50 50 54 52 55 25 29 34 38 42 46 50 20 30 29 24 30 23 25 36 35 30 37 29 30 41 40 35 43 34 35 46 44 40 47 39 40 49 48 44 51 44 45 52 51 48 54 47 50 54 53 50 55 50 24 26 26 16 28 22 19 24 33 20 29 32 32 22 34 28 26 31 41 25 33 37 37 29 39 34 34 38 46 30 37 42 42 36 43 39 41 43 50 35 40 45 46 42 47 44 46 47 53 40 45 48 48 47 50 48 50 50 54 45 50 50 50 50 51 50 52 51 55 50 21 21 25 28 29 35 34 41 38 45 43 48 50 50 Small Study, see Notes 1 & 2 below 30.5 6.9 Small Study, see Notes 1 & 2 below 31.1 5.8 31.3 4.9 34.2 7.5 40.6 6.8 38.9 6.7 42.5 7.4 Small Study, see Notes 1 & 2 below 34.6 5.9 Small Study, see Notes 1 & 2 below 31.2 5.9 40.6 6.6 39.0 6.8 34.2 6.9 41.2 7.3 34.2 7.1 Small Study, see Notes 1 & 2 below No enrolments in 2011 35.5 5.5 36.9 6.5 36.7 6.6 31.0 8.5 38.5 6.4 32.1 7.6 36.3 7.7 38.1 6.4 45.0 7.0 30.2 6.4 Small Study, see Notes 1 & 2 below 29.1 6.1 34.1 7.6 1 of 3 2011 Study Portuguese Punjabi Romanian Russian Serbian Sinhala Spanish Swedish Tamil Turkish Ukrainian Vietnamese Yiddish Mathematics: Further Mathematics Mathematical Methods (CAS) Specialist Mathematics Media Music: Music Performance Music Investigation Music Styles Outdoor & Environmental Studies Philosophy Physical Education Physics Psychology Religion & Society Sociology Studio Arts Systems Engineering Texts & Traditions Theatre Studies Visual Communication & Design VCE VET: VCE VET Business VCE VET Community Services VCE VET Dance VCE VET Electrotechnology VCE VET Engineering Studies – Cert II VCE VET Engineering Studies – Cert III VCE VET Equine Industry VCE VET Financial Services VCE VET Furnishing VCE VET Hospitality VCE VET Hospitality – Kitchen Operations VCE VET Information Technology VCE VET Interactive Digital Media VCE VET Laboratory Skills VCE VET Music VCE VET Music Technical Production VCE VET Sport & Recreation Mean St. Dev. 32.9 5.5 31.1 7.2 Small Study, see Notes 1 & 2 below 36.0 5.4 32.1 6.3 36.3 7.5 33.1 6.7 Small Study, see Notes 1 & 2 below Small Study, see Notes 1 & 2 below 30.0 6.7 Small Study, see Notes 1 & 2 below 34.3 7.0 Small Study, see Notes 1 & 2 below 20 21 20 25 26 26 30 31 31 35 36 36 40 41 41 45 45 46 50 50 50 28 20 21 22 33 26 29 28 37 31 36 33 41 37 42 37 44 42 47 42 47 46 50 46 50 50 51 50 19 24 29 34 39 45 50 22 28 34 39 44 48 50 28.0 34.9 41.2 26.3 7.0 7.1 7.4 7.3 18 24 29 15 23 30 36 20 28 35 42 25 33 40 47 31 38 44 51 37 44 48 53 43 50 50 55 50 29.6 30.0 31.6 24.8 30.5 27.5 32.3 28.5 30.8 26.1 26.1 24.4 30.6 29.3 26.7 7.2 7.3 7.1 6.7 7.7 7.1 7.3 7.2 7.0 7.4 7.2 6.6 7.1 7.3 7.1 19 18 21 15 18 17 21 17 20 15 15 15 21 18 16 24 23 27 19 24 22 27 22 25 20 20 19 26 24 21 29 29 32 24 30 27 32 28 31 25 25 23 31 29 26 34 34 38 29 36 32 38 33 36 31 31 28 36 35 31 40 40 43 35 41 38 43 39 41 38 37 34 41 40 37 45 45 47 41 46 44 47 45 46 44 43 41 45 45 43 50 50 50 50 50 50 50 50 50 50 50 50 50 50 50 15 14 19 17 15 19 17 23 20 18 23 22 26 24 22 29 27 30 28 26 34 32 37 35 34 41 40 43 42 42 50 50 50 50 50 17 22 26 32 37 43 50 14 15 15 15 16 18 20 19 19 21 22 25 24 23 25 27 30 29 28 30 33 36 35 33 36 40 43 41 40 42 50 50 50 50 50 17 16 15 21 20 19 26 25 23 30 30 29 36 35 34 42 42 41 50 50 50 25.0 6.7 23.5 6.4 27.0 6.0 25.6 5.8 24.5 6.4 No enrolments in 2011 27.0 6.5 Small Study, see Note 1 below 24.2 6.0 25.5 6.7 25.0 6.9 24.9 6.3 26.4 6.8 Small Study, see Note 1 below 26.1 6.1 26.2 6.8 24.5 6.9 NOTES: 1. A number of studies were not scaled by the automatic procedure, since their eligible scaling population was less than or equal to eleven. These studies are noted. The means and standard deviations are not given in these cases, since they are not as useful. 2. For the small LOTEs, the LOTE adjustment is the maximum of zero and the average LOTE adjustment over the previous three years. The following table gives the ATAR Subject Scores for small LOTEs in 2011. 16 December 2011 2 of 3 Small LOTE - 2011 ATAR Subject Scores Small LOTE Study Score 2011 ATAR Subject Score Small LOTE Study Score 2011 ATAR Subject Score Small LOTE Study Score 2011 ATAR Subject Score Small LOTE Study Score 2011 ATAR Subject Score Small LOTE Study Score 2011 ATAR Subject Score 1 1 11 12.99 21 25.44 31 36.42 41 45.29 2 2 12 14.26 22 26.62 32 37.41 42 46.05 3 3.09 13 15.53 23 27.79 33 38.37 43 46.8 4 4.26 14 16.8 24 28.94 34 39.31 44 47.52 5 5.46 15 18.06 25 30.07 35 40.23 45 48.2 6 6.69 16 19.32 26 31.18 36 41.12 46 48.86 7 7.93 17 20.56 27 32.27 37 42 47 49.49 8 9.18 18 21.8 28 33.34 38 42.85 48 50.07 9 10.44 19 23.03 29 34.39 39 43.69 49 50.58 10 11.71 20 24.24 30 35.42 40 44.5 50 50.89 2011 Scaled Aggregate Table Based on the 2011 scaling and aggregation process, the following table gives an indication of the minimum scaled aggregate required to achieve at least a particular ATAR. The table can be used to check roughly an ATAR calculation. ATAR 40.00 45.00 50.00 55.00 60.00 62.00 64.00 65.00 66.00 68.00 70.00 72.00 74.00 75.00 76.00 78.00 80.00 82.00 84.00 85.00 86.00 88.00 90.00 91.00 92.00 93.00 94.00 95.00 96.00 97.00 97.50 98.00 98.50 99.00 99.25 99.50 99.60 99.70 99.80 99.90 16 December 2011 Min Scaled Aggregate for ATAR 88.7 95.0 101.4 107.2 113.5 116.0 118.7 120.1 121.3 123.9 126.6 129.2 131.9 133.4 134.9 137.9 141.1 144.3 147.7 149.5 151.4 155.1 159.2 161.5 164.0 166.5 169.3 172.3 176.1 180.4 182.9 185.4 188.7 193.0 195.6 198.6 200.0 201.9 204.5 207.7 3 of 3

