Determining Water Saturation from Capillary Pressure in
Liberty Field, Alaska
Jim Lewis and Fred Jenson
Introduction
Capillary pressure is an important characteristic
of rock that helps reservoir engineers determine
where hydrocarbons and water are located in the
subsurface. This characteristic can be measured from
core samples analyzed in a laboratory setting and
compared to other measurements taken in the field.
Capillary pressure analysis can lead to optimized
drilling programs, allowing reservoir engineers to
find the extent of the hydrocarbon accumulations and
avoid drilling into water.
This study combines well information including
logs and capillary pressure from cores to determine
height above free water and create a water saturation
curve that can be compared to log-derived water
saturation. The study also demonstrates that the
capillary pressure model generated for one well can
be applied to other wells in the field as long as there
is no sealing fault to obstruct fluid flow.
The Arctic Alaska Petroleum Province extends from
the Brooks Range-Herald Arch north to the edge of
the continental shelf and from the U.S.-Canadian
border west to the maritime boundary with Russia.
By 2005 the province had produced about 15 billion
bbls of oil, and more than 20 additional oil and gas
discoveries remained undeveloped.
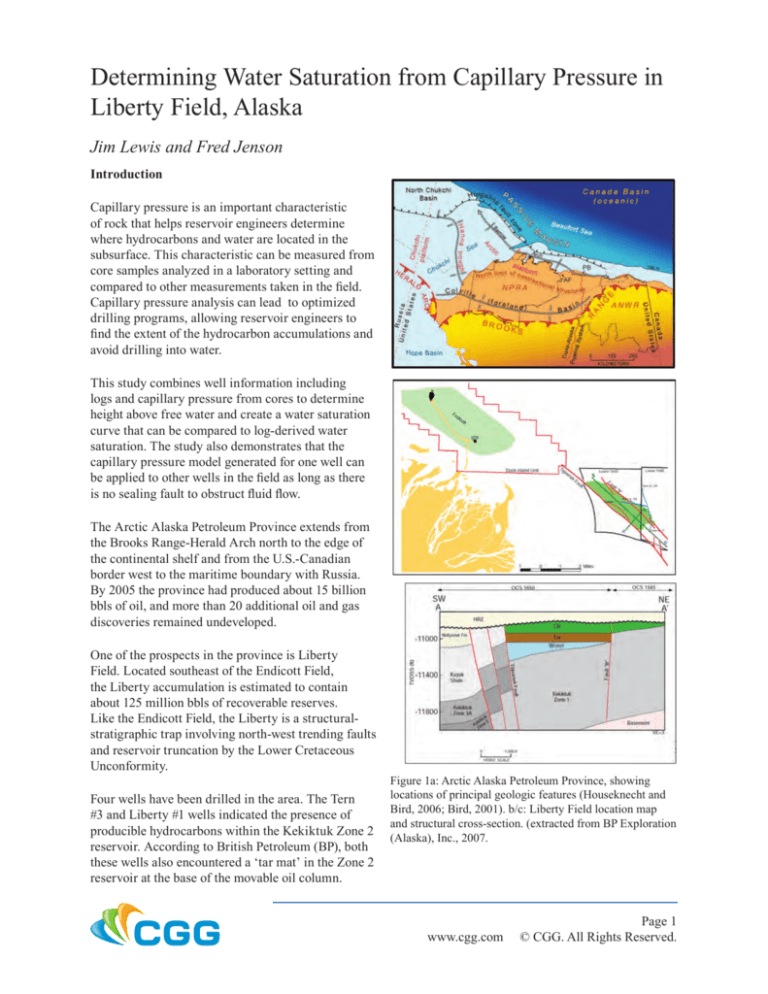
One of the prospects in the province is Liberty
Field. Located southeast of the Endicott Field,
the Liberty accumulation is estimated to contain
about 125 million bbls of recoverable reserves.
Like the Endicott Field, the Liberty is a structuralstratigraphic trap involving north-west trending faults
and reservoir truncation by the Lower Cretaceous
Unconformity.
Four wells have been drilled in the area. The Tern
#3 and Liberty #1 wells indicated the presence of
producible hydrocarbons within the Kekiktuk Zone 2
reservoir. According to British Petroleum (BP), both
these wells also encountered a ‘tar mat’ in the Zone 2
reservoir at the base of the movable oil column.
Figure 1a: Arctic Alaska Petroleum Province, showing
locations of principal geologic features (Houseknecht and
Bird, 2006; Bird, 2001). b/c: Liberty Field location map
and structural cross-section. (extracted from BP Exploration
(Alaska), Inc., 2007.
www.cgg.com
Page 1
© CGG. All Rights Reserved.
Figure 2a: Slabbed Conventional Core, Interval 12976.6 to 12991.1 feet (red arrow & text added to show Plug #3).
Figure 2b: Core Slab with Cap Pressure Plug location for Plug #3, 12,989.30 feet.
Figure 2c: Core Slab with Cap Pressure Plug location for Plug #9, 13,216.55 feet.
Source a: Alaska Department of Natural Resources, Alaska Geological Materials Center Data Report No.336.
Source b/c: Alaska Department of Natural Resources, Alaska Geological Materials Center Data Report No.338.
In Liberty #1, the tar mat lies near the base of Zone 2
at 10,932 ft TVDSS; above it, the oil column extends
to the top of the reservoir at 10,707 feet. No gas cap
was encountered in this well.
In Tern #3, the tar mat extends from 10,922 to 11,045
ft TVDSS. Above it, the first eight feet in the Zone
2 reservoir (10,914 to 10,922 feet) appear to have
movable hydrocarbons. Below the tar mat, a water leg
occurs in the lower portion of the reservoir.
Laboratory data for Tern #3 was evaluated,
conditioned and converted to the reservoir fluid
system. Liberty #1 was used as the control well, to
demonstrate that the model from Tern #3 could be
extended to the field.
Background
Each rock and fluid type has unique features that
can be determined by laboratory measurements.
These physical features can be matched to field data
collected through well logs, cores, borehole images
and other well data. This matching process enables
the reservoir engineer to classify the rocks and
fluids in the field of study. Reservoir engineers are
particularly interested in identifying the gas/brine,
gas/oil and oil/brine interfaces.
The pore spaces inside of rocks are microscopic,
giving capillary forces a significant effect. Their
densities, surface tension and the curvature due to
the spaces between pores make different fluids have
different pressure and as relative saturations change,
pressure difference also changes. Typically, capillary
pressure is measured using mercury injection, porous
plates or centrifuge.
From capillary pressure, reservoir engineers can
discover:
•
Hydrocarbon/water contacts, even if they are
below the total well depth
•
Rock types in the zone(s) of interest
Figure 3a: SEM image, 70x, for Plug #3, 12,989.30 feet.
Figure 3b: SEM image, 700x, for Plug #3, 12,989.30 feet.
Figure 3c: Thin-Section image for Plug #3, 12,989.30 feet.
Source: Alaska Department of Natural Resources, Alaska Geological Materials Center Data Report No.338.
www.cgg.com
Page 2
© CGG. All Rights Reserved.
•
Heights of transition zones
•
Connectivity across the field
Measurements from the field are often
compared to laboratory analysis both as
a quality control step and to broaden the
analysis. For example, the water saturation
and height above free water can be calculated
from resistivity and other wireline logs
and then compared to the depth converted
laboratory core measurement of capillary
pressure. The combination of these methods
provides confirmation of the reliability of the
analysis.
Data Acquisition
Capillary pressure plug data from
conventional core was obtained from the
Alaska Department of Natural Resources for
the Tern #3 well. A total of 422 feet of core
was recovered, but only ten plug samples
comprised this capillary pressure data set.
Figure 4: MICP (mercury-injection capillary pressure)
measurements for Plug #3, 12,989.30 feet. Source: Alaska
Department of Natural Resources, Alaska Geological Materials
Center Data Report No.338.
A set of core slab photographs (indicating the
plug locations), thin sections images, and scanning
electron microscope (SEM) photographs indicated
that there was a grain size, therefore pore size,
difference between the three shallowest plugs and the
deeper plugs. All ten plugs were treated as a set.
The remainder of the standard porosity and
permeability measurements (191 samples) over the
complete core were obtained from the Bureau of
Ocean Energy Management (BOEM) through a
Freedom of Information Act (FOIA) request.
A comprehensive logging package (circa 1987) for
the Tern #3 consisted of conventional wireline log
data (gamma ray, spontaneous potential, caliper;
spherically focused, medium induction, and deep
induction resistivities; sonic travel time, bulk density,
and neutron and density sandstone porosities) were
also obtained from the Alaska Department of Natural
Resources. Other data gathered included geological
tops, TOC (total organic carbon), rock-eval pyrolysis,
whole oil gas chromatograms, directional surveys
and surface location maps.
Comparable data for the other three wells—the
OCS-Y-0195 1, Tern #1; the OCS-Y-0196 1, Tern
#2; and the OCS-Y-1650 1, Liberty #1—were also
obtained from the Alaska Department of Natural
Resources. Capillary pressure data was available only
for the OCS-Y-0197 1, Tern #3 well.
No seismic data was obtained or used in this analysis.
Data Loading
All well data—including logs and cores—were
loaded into PowerLog® for analysis. Quick analysis
showed that the Tern #3 well had an apparent 232
foot hydrocarbon bearing section, overlaying a welldefined waterleg. Three of the cap pressure plugs
were found to be located at the top of the interval,
with the remaining seven located in the waterleg. The
information released by British Petroleum (BP) stated
that a tar mat existed between near the top of the
interval and water zone. No mid-zone cap pressure
plug samples were available, likely because of the
presence of the tar mat.
The conventional core measurements of porosity,
permeability, and grain density from the 191
plugs, which were taken from the 422 feet of core,
www.cgg.com
Page 3
© CGG. All Rights Reserved.
Inc. (SWEPI), who drilled the Tern #3 well. Initial
impressions of the logs were that the Liberty #1 well
looked normal and did not penetrate water.
The high log-measured resistivities in the Tern #3
were suspect, as the logging program only included
the induction curves, which typically are unable to
resolve resistivities when they exceed 200 Ohm-m.
Considerable separations between values were
present for the three resistivity measurements over
the Kekiktuk Zone 2 reservoir. If an impermeable tar
mat were present, no mud filtrate invasion would be
possible and the resistivity logs should have had near
identical values for the shallow, medium and deep
resistivities.
Data Conditioning
Before modeling and analysis, the data was reviewed
for any needed corrections. Capillary pressure data
corrections were applied to correct laboratory data
for borehole conditions. Any extraneous or suspect
data—including individual points, an entire series
or complete collection—could have been excluded at
this time as well.
Figure 5: Tern #3 Log Plot. Source: Data from Alaska
Department of Natural Resources.
indicated that the core depths were approximately
13.25 feet deep to the log measurements. Within the
cored interval of 12,915.0 to 13,361.5 feet, the core
slab photographs indicated oil stained sandstones,
several coal sections, and a brecciated interval from
12,930 to 12,976 feet.
The log resistivities in the Tern #3 were unusually
high, sometimes exceeding 2000 ohm-m, and
therefore suspect. The logging program included
only induction-based resistivity curves which
are often unable to accurately measure formation
resistivities when their values exceed 200 Ohm-m.
Two successful wireline-conveyed Repeat Formation
Tester (RFT) fluid samples (unidentified types) were
reported to the state of Alaska, one of these was
taken over the interval indicated as permeable by
the microlog and the other was taken very near the
water. No mention of a tar mat was found in any
of the available state filings by Shell Western E&P,
Saturation data was converted from percentages
to decimal values and the rock quality index was
calculated. Although the PowerLog Capillary
Pressure module provides an opportunity to apply
stress and clay corrections, these corrections were not
required for this reservoir.
Moving to the Reservoir Fluid System
Option Value Description
σ Res
25
interfacial tension in reservoir (oil-water)
θ Res
30
contact angle in reservoir (oil-water)
σ Lab
485
interfacial tension in the lab (mercury-air)
θ Lab
140
contact angle in lab (mercury-air)
Table 1: MICP interfacial tension and contact angle
constants for laboratory measurements and reservoir
conditions. Source: OMNI Laboratory, Alaska Department
of Natural Resources, Alaska Geological Materials Center
Data Report No.338.
Following data correction, the fluid system used
in the laboratory was converted to the fluid system
found in the reservoir. Capillary pressure is a
www.cgg.com
Page 4
© CGG. All Rights Reserved.
function of the interfacial tension between two
immiscible fluids and the contact angle between the
wetting phase and the rock surface. Consequently,
to convert data from one fluid system to the other,
interfacial tensions (σ) and contact angles (θ) are
needed.
The Leverett J-function was used to normalize
capillary pressure data to take into account variations
in porosity and permeability. This method is useful
for averaging capillary pressure data derived from a
given rock type and reservoir and, with caution, can
sometimes be extended to different reservoirs with
the same lithology.
A quality control check of the oil/water height values
recorded in the lab showed that they were consistent
with the values calculated in PowerLog. Similarly the
plug J-Function values obtained from the lab agreed
with those calculated by PowerLog.
Modeling Capillary Pressure Data
Model input data were normalized for porosity
and permeability using the Rock Quality Index
function. A regression was then performed to fit
the normalized data using a single equation for all
curves.
Figure 6: Liberty #1 Log Plot. Source: Data from
Alaska Department of Natural Resources.
Capillary pressure models can be built using one of
three different approaches.
•
•
Separate Equation for Each Curve—The
model is the regression equation that provides
the best fit to the input plug data. Several types
of regressions can be run, including Thomeer
(G-function) and Skelt Harrison. A separate
regression equation is generated for each plug.
The method for how coefficients developed
for each plug are combined to yield the
coefficients in the final model is then specified.
Methods include taking the average, taking the
median, or doing a linear regression of plug
coefficients versus some specified attribute.
One Equation for All Curves—The model is
the regression equation that provides the best
fit to the input plug data. All the input plug
data are taken together to develop a single,
combined equation. A variety of methods for
normalizing the input data including Leverett
J-function, Cuddy, Rock Quality Index,
and Johnson are available. The algorithm
for normalizing the data (for variations in
porosity, permeability, or both) was used as an
input in the regression equation.
•
Spatial Averaging—The model is a collection
of array attributes and single-value attributes
from input plugs. For example, for a saturation
versus pressure model, the model might
consist of saturation and pressure arrays and
porosity and permeability values. Attributes
are specified and the input data, in essence,
becomes the model. No equation is generated.
When a spatial averaging model is applied,
the water saturation (Sw) for each sample
in the target well is computed based on its
proximity to the corresponding plug data
attribute values. A sequence of linear and
inverse distance weighting interpolations is
performed.
www.cgg.com
Page 5
© CGG. All Rights Reserved.
In addition to the model, all three approaches
output a new saturation attribute. This attribute
was compared to the original to evaluate the model.
Because the “one equation” approach was used, a
J-function attribute was also output and compared to
original data.
Crossplot QC
Quality control is a critical aspect of any subsurface
analysis. Following the regression, several crossplots
were generated to verify the results. These compared
the modeled water saturation to:
•
Pressure
•
Height
•
J-function pressures
•
Rock Quality Index height
These crossplots showed the related fit of the
regression to the input data as well as the match
between the corrected laboratory-based water
saturation and the modeled capillary pressure-based
water saturation. Small adjustments were made to
saturation, pressure and height cutoffs. Although
individual data points or entire plugs could have been
marked as invalid, none were marked in this case.
Figure 8: Tern #3 CPI (computer-processed interpretation)
with saturation comparison.
The regression was rerun several times until the data
was in agreement.
Applying the Model
Once the water saturation model was built, it was
applied to the well and compared to water saturation
calculated from resistivity. There was a good
agreement between the two models.
After verifying the veracity of the Tern #3 analysis,
the model was applied to the Liberty #1 well. In
general, capillary pressure models are applicable
to wells in the same field and with similar porosity
regimes and lithologies.
The water saturation-versus-pressure model was
converted to a water saturation-versus-height model
by replacing the pressure attribute with height above
free water level (in true vertical depth), reservoir
porosity and permeability. The output was a water
saturation curve which had no dependency on a
resistivity log measurement.
Figure 7: A Comparison of Capillary Pressure Based
Saturations vs Height above FWL (Swcorrected from data
conversion from laboratory to reservoir and SwModeled
from Rock Quality Index Method Regression).
Using a structure map, the water saturation model
derived from capillary pressure can be applied
across the field to determine hydrocarbons present.
This approach assumes that the rock is the same
everywhere within the study area—deposited
www.cgg.com
Page 6
© CGG. All Rights Reserved.
well within the same connected reservoir even when
there is no water contact. Understanding where the
fluid contacts are leads directly to improved decisionmaking in the drilling program.
Managing all well data in a single database
provides great value for iterative analysis and
future modification. It also enables geoscientists to
review how the data was used in the model, what
assumptions were made and what calculations were
applied. It makes it easy to add more data as it is
acquired, enhancing the model. This practice ensures
consistency across the field lifecycle.
References
Figure 9: Liberty #1 CPI with saturation comparison.
under the same conditions from the same source
and with the same porosity and permeability. As
long as there are no sealing faults, water level
can be safely assumed to be the same, because
water seeks the same level. If there are multiple
zones with the same free water levels, then the
zones are in communication. This helps determine
compartmentalization.
Conclusions
The capillary pressure model developed from one
well successfully predicted the water saturation data
in another well within the same field. By applying
the two separate saturation models, one based on
the fine-grained samples and the other based on the
coarse-grained samples, a prediction might have been
possible for an expected range of water saturations
for the two rock types for comparison to the actual
log based water saturation.
The capillary pressure analysis of Tern #3 provided
a more consistent indication of water saturation than
using the traditional resistivity-based computed
saturation. The water saturation curve proved
consistent with Liberty #1, for which there were no
capillary pressure measures available and water had
not been contacted. The analysis demonstrated the
ability to use capillary pressure data from one well
to calculate height above free water for any other
Alaska Department of Natural Resources, Division
of Oil and Gas, 2011, Point Thompson Area.Available
online at: dog.dnr.alaska.gov.
Bird, K.J., 2001. Alaska; a twenty-first-century
petroleum province, in Downey, M.W., Threet, J.C., and
Morgan, W.A., eds., Petroleum provinces of the twentyfirst century: American Association of Petroleum
Geologists Memoir 74, p. 137–165.
BP Exploration (Alaska) Inc., 2007. Liberty
Development Project Development and Production
Plan. Submitted to U.S. Minerals Management Service.
Anchorage, Alaska.
Holmes, Michael. “Capillary Pressure & Relative
Permeability Petrophysical Reservoir Models.” Digital
Formation, 2002.
Houseknecht, D.W., and Bird, K.J., 2006. Oil and gas
resources of the Arctic Alaska petroleum province:
U.S. Geological Survey Professional Paper 1732-A, 11
p., available online at: http://pubs.usgs.gov/pp/pp1732/
pp1732a/index.html.
Omni Laboratories, Inc., 2007, Core analyses of the
Shell Oil Company OCS Y-0197-1 (Tern Island #3) well
(12977.25’-13221.35’); which includes permeability and
porosity data, mercury injection capillary pressure data,
X-ray diffraction dat, sample photographs, petrographic
thin-section photographs, and SEM photographs:
Alaska Division of Geological & Geophysical Surveys
Geologic Materials Center Data Report 338, 41 p.
Shell Oil Company and Alaska Geological Materials
Center, 2006, Core Photographs (12915’-13361.5’) dated
June 2003 of the Shell Oil Company OCS Y-0197-1
(Tern Island #3) at the Alaska GMC: Alaska Division of
Geological & Geophysical Surveys Geologic Materials
Center Data Report 336, 3 p.
www.cgg.com
Page 7
© CGG. All Rights Reserved.


