Graphing Exercises and Practice
advertisement
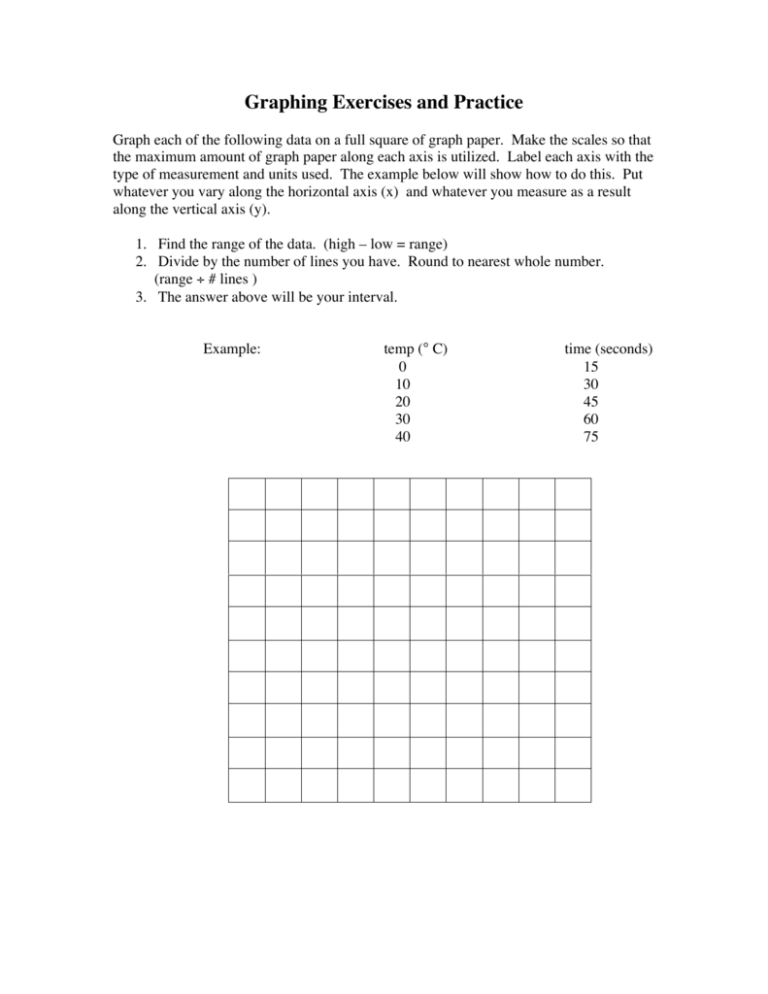
Graphing Exercises and Practice Graph each of the following data on a full square of graph paper. Make the scales so that the maximum amount of graph paper along each axis is utilized. Label each axis with the type of measurement and units used. The example below will show how to do this. Put whatever you vary along the horizontal axis (x) and whatever you measure as a result along the vertical axis (y). 1. Find the range of the data. (high – low = range) 2. Divide by the number of lines you have. Round to nearest whole number. (range ÷ # lines ) 3. The answer above will be your interval. Example: temp (° C) 0 10 20 30 40 time (seconds) 15 30 45 60 75 1.) The time in seconds was measured at different concentrations in moles per liter for a “clock” reaction. The following data was obtained. Graph. Concentration (moles per liter) Time ( ) 0.01 5.7 0.008 8.2 0.006 12.6 0.004 22.8 0.002 65.0 2.) The pressure of a gas was measured in atmospheres as the volume in liters was varied. The following data was obtained. Graph the data set. Pressure (atmospheres) Volume ( ) 2.0 4.0 0.0060 0.0030 6.0 0.0020 8.0 0.0015 10.0 0.0012 12.0 0.0010 3.) The happiness of chemistry students was measured in zogs as the amount of homework hours were varied. Graph the data. 1.00 is perfect happiness. ___________________ ( ) 0.008 0.03 0.13 0.22 0.48 0.96 6.5 3.4 1.6 0.80 0.35 0.02 ___________________(Hours) Use the computer to graph the following data sets. 1.) A chemist measured the pressure of a gas in atmospheres at different temperatures in °C. Graph data. Predict the temperature at which the pressure would equal zero from the graph. Temp (°C) Pressure (atm) -136 0.50 -25 0.91 0 1.00 25 1.09 100 1.37 273 2.00 2.) The solubility of potassium dichromate in grams per 100 grams of water was measured at different temperatures in °C. Graph the data. Predict the solubility at 110 C. Temp (°C) 0 Solubility 5 (g/100 g H2O) 20 14 30 20 45 28 60 41 70 54 100 104 3.) The following data was obtained when water was introduced into a vacuum chanber until some liquid was seen in the chamber. The pressure in mbar was then measured at different temperatures in °C. Graph the data. Temp ( ) Pressure ( ) 5 8 8.7 10.7 12 14.0 14 16.0 18 20.6 23 28.1 27 35.6 35 56.2 50 70 123 312
