padini holdings
CONSUMER
PADINI HOLDINGS
(PAD MK, PDNI.KL)
PP 12247/06/2012 (030106)
11 May 2012
Expansion plan remains on track
Company report
BUY
AmResearch Sdn Bhd
www.amesecurities.com.my
+603 2036 2304
Price
Fair Value
52-week High/Low
Key Changes
RM1.75
RM2.15
RM1.79/RM0.83
Fair value
EPS
YE to June
Revenue (RMmil)
Core net profit (RMmil)
EPS (Sen)
EPS growth (%)
Consensus EPS (Sen)
DPS (Sen)
PE (x)
EV/EBITDA (x)
Div yield (%)
ROE (%)
Net Gearing (%)
Stock and Financial Data
Unchanged
FY11
568.5
74.7
11.3
24.7 n/a
FY12F
648.9
83.1
12.7
11.5
13.2
FY13F
732.1
98.8
15.1
19.2
15.2
FY14F
801.6
104.4
16.0
5.9
17.7
4.0
15.4
10.7
4.0
13.8
9.7
4.5
11.6
7.8
5.0
11.0
7.0
2.3
28.9
2.3
27.4
2.6
27.5
2.9
24.4
Net cash Net cash Net cash Net cash
Shares Outstanding (million) 657.9
Market Cap (RMmil) 1,151.3
Book value (RM/share)
P/BV (x)
ROE (%)
Net Gearing (%)
Major Shareholders
0.43
4.1
28.9
Net cash
Free Float (%)
Avg Daily Value (RMmil)
Price performance
Yong Pang Chuan (43.9%)
Amanahraya Trustee Berhad (5.0%)
47.6
3.4
3mth 6mth 12mth
Absolute (%)
Relative (%)
34.6
33.4
75.0
68.6
57.7
53.4
2.00
1.50
Rationale for report: Company Visit
1,684
1,553
Investment Highlights
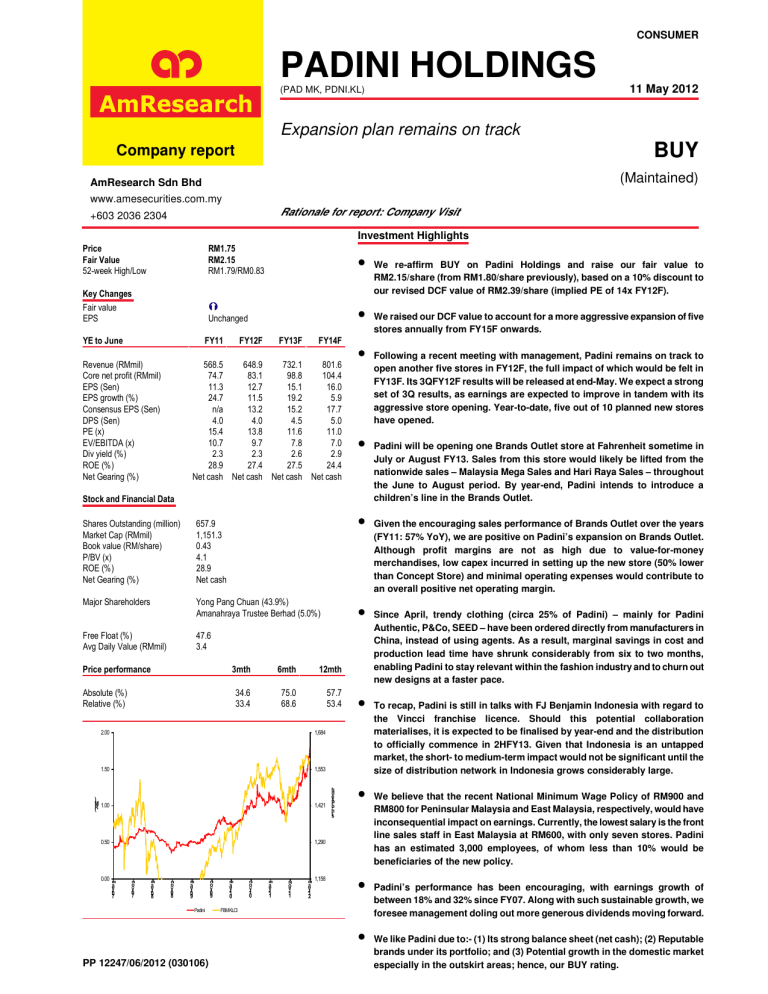
• We re-affirm BUY on Padini Holdings and raise our fair value to
RM2.15/share (from RM1.80/share previously), based on a 10% discount to our revised DCF value of RM2.39/share (implied PE of 14x FY12F).
•
• Following a recent meeting with management, Padini remains on track to
• Padini will be opening one Brands Outlet store at Fahrenheit sometime in
July or August FY13. Sales from this store would likely be lifted from the
• Given the encouraging sales performance of Brands Outlet over the years
(FY11: 57% YoY), we are positive on Padini’s expansion on Brands Outlet.
• Since April, trendy clothing (circa 25% of Padini) – mainly for Padini
•
We raised our DCF value to account for a more aggressive expansion of five stores annually from FY15F onwards.
(Maintained)
open another five stores in FY12F, the full impact of which would be felt in
FY13F. Its 3QFY12F results will be released at end-May. We expect a strong set of 3Q results, as earnings are expected to improve in tandem with its aggressive store opening. Year-to-date, five out of 10 planned new stores have opened. nationwide sales – Malaysia Mega Sales and Hari Raya Sales – throughout the June to August period. By year-end, Padini intends to introduce a children’s line in the Brands Outlet.
Although profit margins are not as high due to value-for-money merchandises, low capex incurred in setting up the new store (50% lower than Concept Store) and minimal operating expenses would contribute to an overall positive net operating margin.
Authentic, P&Co, SEED – have been ordered directly from manufacturers in
China, instead of using agents. As a result, marginal savings in cost and production lead time have shrunk considerably from six to two months, enabling Padini to stay relevant within the fashion industry and to churn out new designs at a faster pace.
To recap, Padini is still in talks with FJ Benjamin Indonesia with regard to the Vincci franchise licence. Should this potential collaboration materialises, it is expected to be finalised by year-end and the distribution to officially commence in 2HFY13. Given that Indonesia is an untapped market, the short- to medium-term impact would not be significant until the size of distribution network in Indonesia grows considerably large.
In d
)
M
(R
1.00
0.50
1,421
1,290
• We believe that the recent National Minimum Wage Policy of RM900 and
RM800 for Peninsular Malaysia and East Malaysia, respectively, would have inconsequential impact on earnings. Currently, the lowest salary is the front line sales staff in East Malaysia at RM600, with only seven stores. Padini has an estimated 3,000 employees, of whom less than 10% would be beneficiaries of the new policy.
0.00
07 y-
M a
07 v-
N o
08 y-
M a
08 v-
N o
09 y-
M a
Padini
09 v-
N o
M y-
10
FBM KLCI
10 v-
N o
11 y-
M a
11 v-
12 y-
M a
1,158
• Padini’s performance has been encouraging, with earnings growth of between 18% and 32% since FY07. Along with such sustainable growth, we foresee management doling out more generous dividends moving forward.
• We like Padini due to:- (1) Its strong balance sheet (net cash); (2) Reputable brands under its portfolio; and (3) Potential growth in the domestic market especially in the outskirt areas; hence, our BUY rating.
Padini Holdings
4.0
3.2
)
(x
2.4
1.6
0.8
0.0
D ec
M a
CHART 1 : PB BAND CHART
S e
0
D ec
M a
D e
M a
+1s
Avg
-1s
16.0
13.0
10.0
)
(x
7.0
4.0
1.0
D ec
M a
CHART 2 : PE BAND CHART
D ec
M a
11 May 2012
M a
+1s
Avg
-1s
AmResearch Sdn Bhd 2
Padini Holdings
AmResearch Sdn Bhd
11 May 2012
Income Statement (RMmil, YE 30 June)
Revenue
EBITDA
Depreciation
Operating income (EBIT)
Other income & associates
Net interest
Exceptional items
Pretax profit
Taxation
Minorities/pref dividends
Net profit
Core net profit
Balance Sheet (RMmil, YE 30 June)
Fixed assets
Intangible assets
Other long-term assets
Total non-current assets
Cash & equivalent
Stock
Trade debtors
Other current assets
Total current assets
Trade creditors
Short-term borrowings
Other current liabilities
Total current liabilities
Long-term borrowings
Other long-term liabilities
Total long-term liabilities
Shareholders’ funds
Minority interests
BV/share (RM)
Cash Flow (RMmil, YE 30 June)
Pretax profit
Depreciation
Net change in working capital
Others
Cash flow from operations
Capital expenditure
Net investments & sale of fixed assets
Others
Cash flow from investing
Debt raised/(repaid)
Equity raised/(repaid)
Dividends paid
Others
Cash flow from financing
Net cash flow
Net cash/(debt) b/f
Net cash/(debt) c/f
Key Ratios (YE 30 June)
Revenue growth (%)
EBITDA growth (%)
Pretax margins (%)
Net profit margins (%)
Interest cover (x)
Effective tax rate (%)
Net dividend payout (%)
Debtors turnover (days)
Stock turnover (days)
Creditors turnover (days)
Source: Company, AmResearch estimates
TABLE 1 : FINANCIAL DATA
58.6
26.1
26.6
111.4
10.1
0.8
10.9
234.3
0.0
0.36
2010
80.8
7.0
4.5
92.3
135.0
76.6
32.6
20.2
264.3
(1.1)
4.7
0.0
85.2
(25.3)
0.0
59.9
59.9
2010
2010
518.8
81.6
0.0
81.6
0.0
(17.8)
(3.5)
(13.5)
69.2
61.4
98.8
2010
9.1
27.1
16.4
11.5
74.6
29.7
33.0
23
59 n/a
85.2
21.8
26.8
(23.6)
110.2
(25.7)
0.1
(2.0)
(27.6)
7.8
93.9
24.9
19.1
137.9
22.2
1.6
23.7
282.7
0.0
0.43
2011
83.6
6.5
4.4
94.6
138.6
171.0
39.4
0.7
349.8
(1.0)
6.0
0.0
104.0
(29.4)
0.0
74.7
74.7
2011
2011
568.5
99.1
0.0
99.1
0.0
(32.9)
(0.7)
(22.1)
3.4
(8.1)
91.5
2011
9.6
21.5
18.3
13.1
63.0
28.2
35.2
23
79
49
104.0
22.3
(69.0)
(27.6)
29.8
(24.7)
20.4
0.0
(4.3)
11.5
51.6
3.1
7.4
62.1
19.0
1.6
20.6
325.2
0.0
0.49
2012F
87.4
7.0
4.4
98.8
100.4
131.3
33.9
43.5
309.1
2012F
648.9
110.3
0.0
110.3
0.0
5.1
0.0
115.5
(32.3)
0.0
83.1
83.1
2012F
0.0
(26.3)
5.0
(24.6)
(36.1)
(32.8)
78.3
2012F
14.1
11.3
17.8
12.8
75.9
28.0
31.7
21
85
41
115.5
24.8
(87.4)
(34.6)
18.2
(30.0)
0.3
0.0
(29.7)
(3.3)
45.6
2.2
11.5
59.3
14.5
1.6
16.0
466.0
0.0
0.71
2014F
87.2
7.9
4.4
99.6
210.3
105.7
31.0
94.8
441.8
2014F
801.6
136.3
0.0
136.3
0.0
8.7
0.0
145.0
(40.6)
0.0
104.4
104.4
2014F
0.0
(29.6)
8.4
(23.7)
68.0
70.5
193.6
2014F
9.5
3.4
18.1
13.0
124.6
28.0
31.5
15
48
22
145.0
29.8
(6.8)
(46.5)
121.5
(30.0)
0.3
0.0
(29.7)
(2.5)
49.3
2.6
9.2
61.2
16.6
1.6
18.1
394.5
0.0
0.60
2013F
88.5
7.4
4.4
100.4
142.2
106.9
32.9
91.3
373.4
2013F
732.1
131.8
0.0
132
0.0
5.5
0.0
137.3
(38.4)
0.0
98.8
98.8
2013F
0.0
(26.3)
5.1
(24.1)
41.9
44.7
123.1
2013F
12.8
19.4
18.8
13.5
104.6
28.0
30.0
17
59
25
137.3
27.3
(27.8)
(41.1)
95.7
(30.0)
0.3
0.0
(29.7)
(2.9)
3
Padini Holdings
Anchor point for disclaimer text box
11 May 2012
Published by
AmResearch Sdn Bhd (335015-P)
(A member of the AmInvestment Bank Group)
1 5 t h F l o o r B a n g u n a n A m B a n k G r o u p
55 Jalan Raja Chulan
50200 Kuala Lumpur
Tel: ( 0 3 ) 2 0 7 0 - 2 4 4 4 ( r e s e a r c h )
F a x : ( 0 3 ) 2 0 7 8 - 3 1 6 2
Printed by
AmResearch Sdn Bhd (335015-P)
(A member of the AmInvestment Bank Group)
1 5 t h F l o o r B a n g u n a n A m B a n k G r o u p
55 Jalan Raja Chulan
50200 Kuala Lumpur
Tel: ( 0 3 ) 2 0 7 0 - 2 4 4 4 ( r e s e a r c h )
F a x : ( 0 3 ) 2 0 7 8 - 3 1 6 2
AmResearch Sdn Bhd
The information and opinions in this report were prepared by AmResearch Sdn Bhd. The investments discussed or recommended in this report may not be suitable for all investors. This report has been prepared for information purposes only and is not an offer to sell or a solicitation to buy any securities. The directors and employees of AmResearch Sdn Bhd may from time to time have a position in or with the securities mentioned herein. Members of the AmInvestment Group and their affiliates may provide services to any company and affiliates of such companies whose securities are mentioned herein. The information herein was obtained or derived from sources that we believe are reliable, but while all reasonable care has been taken to ensure that stated facts are accurate and opinions fair and reasonable, we do not represent that it is accurate or complete and it should not be relied upon as such. No liability can be accepted for any loss that may arise from the use of this report. All opinions and estimates included in this report constitute our judgement as of this date and are subject to change without notice.
For AmResearch Sdn Bhd
Benny Chew
Managing Director
