Group Corporate structure
advertisement
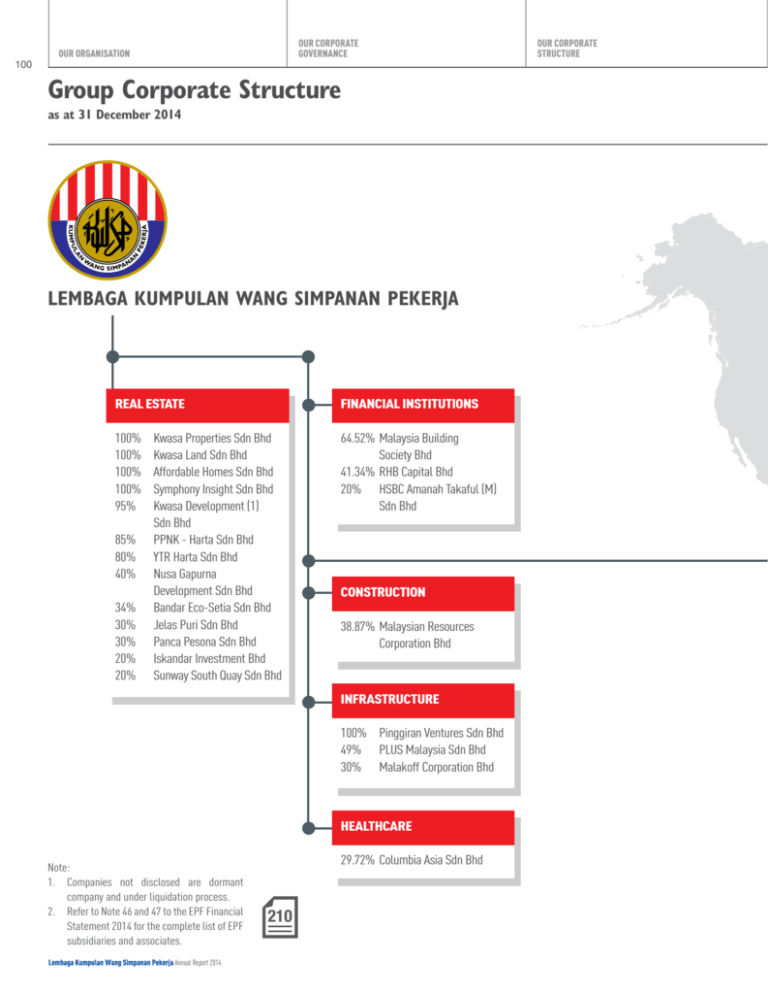
100 OUR CORPORATE GOVERNANCE OUR ORGANISATION Group Corporate Structure as at 31 December 2014 LEMBAGA KUMPULAN WANG SIMPANAN PEKERJA Real Estate financial institutions 100% 100% 100% 100% 95% 85% 80% 40% 34% 30% 30% 20% 20% 64.52%Malaysia Building Society Bhd 41.34%RHB Capital Bhd 20% HSBC Amanah Takaful (M) Sdn Bhd Kwasa Properties Sdn Bhd Kwasa Land Sdn Bhd Affordable Homes Sdn Bhd Symphony Insight Sdn Bhd Kwasa Development (1) Sdn Bhd PPNK - Harta Sdn Bhd YTR Harta Sdn Bhd Nusa Gapurna Development Sdn Bhd Bandar Eco-Setia Sdn Bhd Jelas Puri Sdn Bhd Panca Pesona Sdn Bhd Iskandar Investment Bhd Sunway South Quay Sdn Bhd construction 38.87%Malaysian Resources Corporation Bhd infrastructure 100% Pinggiran Ventures Sdn Bhd 49% PLUS Malaysia Sdn Bhd 30% Malakoff Corporation Bhd Healthcare Note: 1. Companies not disclosed are dormant company and under liquidation process. 2. Refer to Note 46 and 47 to the EPF Financial Statement 2014 for the complete list of EPF subsidiaries and associates. Lembaga Kumpulan Wang Simpanan Pekerja Annual Report 2014 29.72%Columbia Asia Sdn Bhd 210 OUR CORPORATE STRUCTURE OUR BUSINESS REVIEW BY DIVISIONS YEAR 2014 IN PERSPECTIVE OUR ACCOUNTABILITY OUR FINANCIAL REPORTS 07 Group Corporate Structure (Cont’d.) as at 31 December 2014 Global 100% Kwasa Global (Jersey) Ltd 100% Kwasa Global 2 (Jersey) Ltd 100% Kwasa Invest Ltd 100% Kwasa Singapore (Solo) Pte Ltd 99.5% Merbau Investors Offshore LP 99.5% Cengal Private Equity Investment PLC 100% Kwasa Singapore (Duo) Pte Ltd 99.34%Cengal Private Equity Investments PLC II 100% Kwasa Singapore (Trio) Pte Ltd 99.25%Meranti Fund L.P. 100% Kwasa Australia Trust 99% Merbau Investors Offshore II LP 100% Kwasa Australia Pty Ltd 100% Kwasa Europe S.A.R.L 100% Kwasa Infrastructure 1 99% Jati Private Equity Fund LP 99% Jati Private Equity Fund II LP 100% Kwasa Capital Limited Lembaga Kumpulan Wang Simpanan Pekerja Annual Report 2014 101 102 OUR ORGANISATION OUR CORPORATE GOVERNANCE OUR CORPORATE STRUCTURE Financial Overview and Analysis FINANCIAL RESULTS Operating Expenditure Gross Investment Income In 2014, the EPF’s operating expenditure decreased by 4.72% to RM1,122.33 million, compared with RM1,177.94 million in 2013. This was primarily contributed by one-off gratuity provision to retirees beginning in June 2013 amounting to RM206.51 million. Higher staff costs, maintenance costs and depreciation charges by RM111.64 million, RM7.58 million and RM6.87 million respectively partially offset the decrease. The EPF posted a gross investment income of RM39.08 billion in 2014, which was RM4.08 billion or 11.66% higher than the RM35.00 billion achieved in 2013. The increase was due mainly to a 32.81% growth (RM4.14 billion) in capital gain from the trading of investment from the previous year to RM16.76 billion. In the face of the drop in domestic and global equity markets, falling oil prices and a weakening of major currencies against the US Dollar in the last quarter of 2014, the fund managers’ decision to realise higher income in the early part of the year was effective. In addition, the well diversified portfolio allowed our fund managers to capitalise on those markets with positive returns. Of the growth, RM2.78 billion was generated from our internally managed investments, while the balance of RM865.07 million was from our external fund managers. Salaries, Allowances and Staff Costs Staff costs increased by 15.82% to RM817.14 million, compared with RM705.50 million in 2013, as a result of higher emolument and allowances, following the impact of annual salary increment and a promotion exercise in 2014. Depreciation and Amortisation Charges As for dividend on investments, both internally and externally managed investments recorded a combined year-on-year growth of 7.31%, or RM576.72 million, in line with the EPF’s increased investment holdings and steady earnings recorded by investee companies from our domestic and global mandates. More than 50% of the fund is invested in fixed income instruments, which continued to provide steady income. The return from our combined heldto-maturity (HTM) and available for sale (AFS) instruments was RM346.06 million or 3.54% more than the RM9.77 billion posted in 2013. This positive result was due to increased exposure to these instruments and outperformance of our global fixed income mandates, particularly by our external fund managers. Interest income from each of loans, advances and financing, bank balances and rentals was consistent with results recorded in the previous year. The bulk of the RM951.05 million net unrealised loss from financial assets at fair value through profit / loss (FVTPL) was attributed to the loss in value of the FX Forward Contract currency hedging instrument. This was in line with the weakening of the Malaysian Ringgit against the US Dollar towards end 2014. Nevertheless, the EPF achieved a net gain of RM1.18 billion from FX comprising both unrealised and realised gains for the year. The currency hedging policy was put in place in accordance with our prudent and conservative investment strategy to minimise FX losses in any particular year. Depreciation and amortisation charges comprise the depreciation in value of property, plants and equipment, investment properties as well as amortisation of intangible assets and prepaid land lease. For the financial year ended 31 December 2014, depreciation and amortisation charges increased by 8.34% to RM89.21 million, compared with RM82.34 million in the preceding year. This was due to higher settlement of Work-In-Progress Account on completed projects amounting to RM7.34 million. Maintenance Costs Maintenance costs include the maintenance of computer equipment and buildings, cleaning costs as well as utility charges. In the financial year ended 31 December 2014, maintenance charges increased by 12.20% to RM69.70 million, compared with RM62.12 million in the preceding year. This was primarily due to an RM4.13 million increase in the maintenance costs of our computer equipment and buildings. A higher electricity tariff beginning January 2014 also increased our electricity bills, which amounted to RM3.41 million. Statutory Charges Statutory charges consist of the payment of Death Benefits and Incapacitation Benefits to beneficiaries and members under Sections 58(1) and 58(2) respectively as well as Invocation Cost under Section 50(3) of the EPF Act, 1991, which was recognised during the year. Other Income FINANCIAL POSITION Other Income increased by 5.87% to RM165.82 million from RM156.63 million in 2013. This included RM57.80 million in dividend and interest from late contributions by employers, compared with RM57.50 million in the preceding year, forming 34.86% of the total Other Income in 2014. Apart from this, service fees of RM45.69 million from Fund Manager Institutions, which manage members’ funds under the Members Investment Withdrawal Scheme, contributed to 27.55% of Other Income, marking an increase of RM6.65 million from 2013, in line with the increase in funds withdrawn by members under this scheme. Lembaga Kumpulan Wang Simpanan Pekerja Annual Report 2014 Investment Assets Total investment assets grew by RM46.57 billion or 7.89% from RM590.01 billion as at end 2013 to RM636.58 billion. This was due mainly to the increase in available for sale (AFS) financial assets, which contributed RM27.19 billion or 10.06% to the overall growth. On the back of stronger performance in the equity market, the allocation for equities, which makes up the majority of the AFS assets, was progressively raised within tolerable limits. Supported by encouraging trading volumes despite mixed index movements in various markets, the value of AFS assets closed at RM297.37 billion, and represented 46.71% of the total investments. OUR BUSINESS REVIEW BY DIVISIONS YEAR 2014 IN PERSPECTIVE OUR ACCOUNTABILITY OUR FINANCIAL REPORTS 07 Financial Overview and Analysis (Cont’d.) On the EPF’s exposure to low-risk and steady-stream income investments, assets in held to maturity (HTM) and loans, advances and financing stood at RM191.71 billion (30.12%) and RM89.66 billion (14.08%) respectively. There was a -3.32% or RM3.08 billion drop in investments in loans, advances and financing while HTM assets increased by RM3.21 billion or 1.70%. Combined, these investment assets increased marginally by RM0.13 billion or 0.05% compared with the previous year. Liabilities In 2014, additional investments were also made into our subsidiaries and associate companies, particularly into the foreign inflation-linked asset class. Cumulatively, the holdings in both subsidiaries and associate companies stood at RM25.72 billion or 4.04% of our total investments, an increase of RM4.86 billion or 23.30% from RM20.86 billion in 2013. As at 31 December 2014, the EPF’s payables and accrued liabilities of RM4.99 billion was up 42.17% compared with RM3.51 billion as of 31 December 2013. The increase was mainly due to higher purchases of global bond and equities close to year end. Total liabilities grew by 48.51% to RM6.49 billion from RM4.37 billion in 2013, primarily due to higher accruals on the purchase of investment instruments close to year end for which settlements were made in the following month. Payables and Accrued Liabilities Contributions 1% 2% 0% 3% 46% 16% 2013 Cumulative contributions stood at RM598.57 billion as at 31 December 2014, indicating growth of 11.13%, or RM59.94 billion, from the closing balance of RM538.63 billion as of 2013. Members’ cumulative savings in the Contribution Account, as reflected in the Statement of Financial Position, grew as employers’ contributions exceeded the total paid in withdrawals to members and beneficiaries, resulting in a consistent net cash inflow throughout the year. Collection During the Year In 2014, a total of RM54.93 billion was collected from employers, as opposed to RM50.72 billion in the preceding year. This represented an increase of RM4.21 billion, or 8.30%, consistent with higher wages as well as growth in the number of active members. On average, approximately RM4.58 billion was collected per month in 2014. 32% Withdrawals and Refunds During the Year 0% 5% 2% 2% 47% 14% 2014 30% Available for Sale Financial Assets Total withdrawals and refunds in 2014 amounted to RM33.78 billion, compared with RM35.47 billion in the previous year. This reflected a drop of RM1.69 billion, or 4.76%, primarily due to a decrease in withdrawals under the Members Investment Withdrawal Scheme. Details of withdrawals are provided in the Statistics section of this Annual Report. On average, approximately RM2.82 billion was paid to members and beneficiaries per month in 2014. Other Members’ Fund Other Members’ Fund stood at RM41.64 billion as at 31 December 2014, comprising RM1.45 billion in accumulated surplus (distributable reserves) and RM40.18 billion in available for sale (AFS) financial asset reserves (non-distributable reserves). This marked a decrease of RM13.18 billion, or 24.04%, from the Other Members’ Fund of RM54.82 billion in 2013, in line with declining AFS reserves due to more active trading with regard to listed equities apart from a marginal down trend in the stock market performance. Held To Maturity Investment Assets Loans, Advances and Financing Investment in Associates Investment in Subsidiaries Financial Assets at Fair Value Through Profit / Loss Others Lembaga Kumpulan Wang Simpanan Pekerja Annual Report 2014 103

