IB Biology Statistical Analysis Practice Test Answer Sheet
advertisement
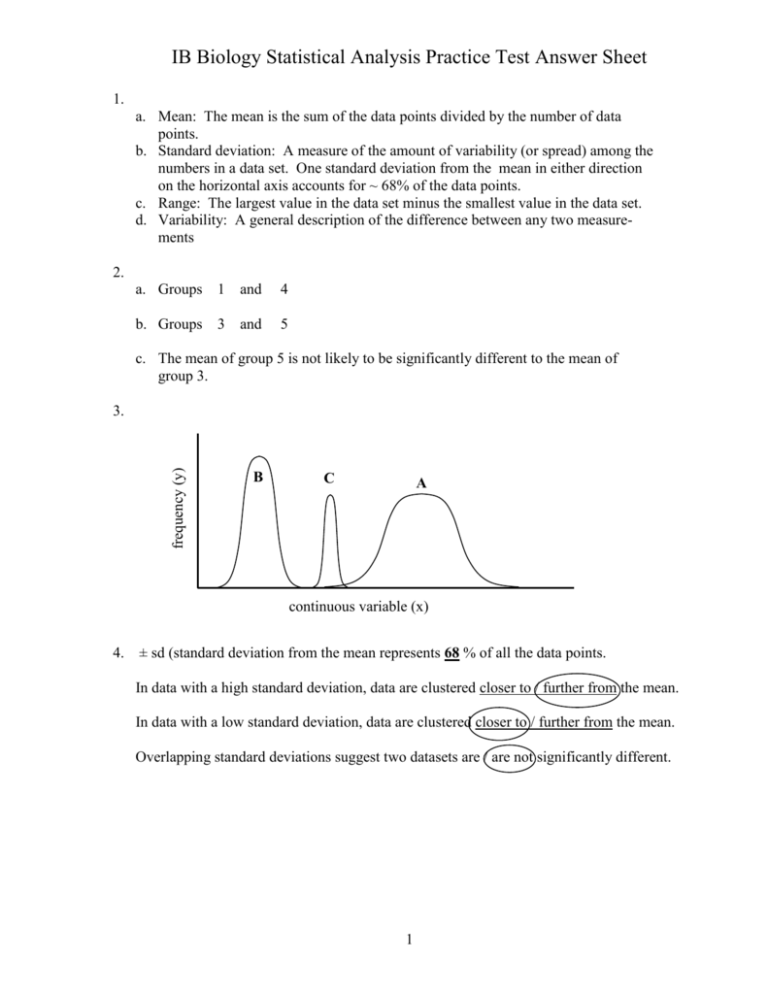
IB Biology Statistical Analysis Practice Test Answer Sheet 1. a. Mean: The mean is the sum of the data points divided by the number of data points. b. Standard deviation: A measure of the amount of variability (or spread) among the numbers in a data set. One standard deviation from the mean in either direction on the horizontal axis accounts for ~ 68% of the data points. c. Range: The largest value in the data set minus the smallest value in the data set. d. Variability: A general description of the difference between any two measurements 2. a. Groups 1 and 4 b. Groups 3 and 5 c. The mean of group 5 is not likely to be significantly different to the mean of group 3. frequency (y) 3. B C A continuous variable (x) 4. ± sd (standard deviation from the mean represents 68 % of all the data points. In data with a high standard deviation, data are clustered closer to / further from the mean. In data with a low standard deviation, data are clustered closer to / further from the mean. Overlapping standard deviations suggest two datasets are / are not significantly different. 1 IB Biology Statistical Analysis Practice Test Answer Sheet 6. Mean = Stdev = p= Group A 24 25 26 23 25 25 26 27 23 23 Group B 24 29 25 23 29 32 34 31 32 29 24.7 1.4 0.004 28.8 3.7 (T-Test) Group A 2 A - Abar (A - Abar) -0.7 0.49 0.3 0.09 1.3 1.69 -1.7 2.89 0.3 0.09 0.3 0.09 1.3 1.69 2.3 5.29 -1.7 2.89 -1.7 2.89 Σ= 18.1 Group B 2 B - Bbar (B - Bbar) -4.8 23.04 0.2 0.04 -3.8 14.44 -5.8 33.64 0.2 0.04 3.2 10.24 5.2 27.04 2.2 4.84 3.2 10.24 0.2 0.04 Σ= 123.6 7. If P is less than 0.05, then the difference between the two means is significant. Assuming a null hypothesis has been stated that there is no significant difference between the means of the two groups, then the calculated P-value of 0.004 results in a rejection of this null hypothesis. When two means are subjected to a statistical test where p = 0.05, it indicates that the null hypothesis will have a 95% chance of being true. However, the means of the two groups in our example beat the odds and show less than a 5% chance that they would be within 2 standard deviations of each other. Thus, these two means are statistically different from each other. 8. T-tests enable scientists to express probabilities that any two events will occur by chance alone. These probabilities help scientist’s better frame debates about topics such as global warming, evolution, etc. in objective and meaningful ways. 9. a. b. c. d. e. f. False. True False False False True 10. The presence of chlorophyll as a function of temperature (leaves changing color). Rate of osmosis as a function of membrane surface area. 2

