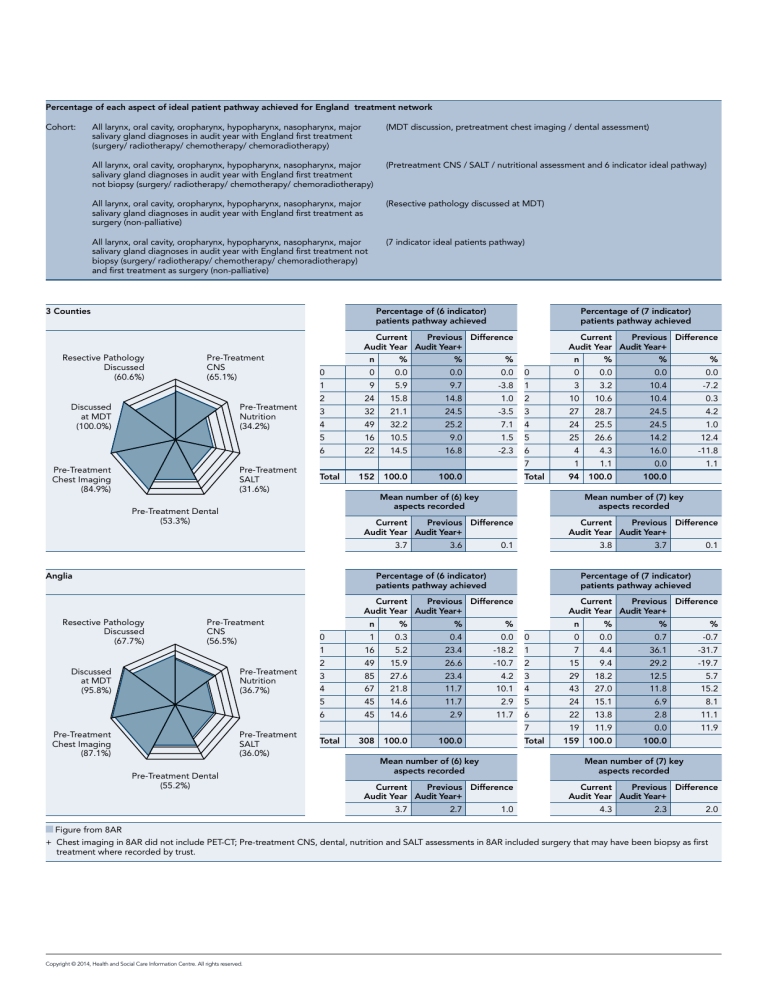
Percentage of each aspect of ideal patient pathway achieved for England treatment network
Cohort:
All larynx, oral cavity, oropharynx, hypopharynx, nasopharynx, major
salivary gland diagnoses in audit year with England first treatment
(surgery/ radiotherapy/ chemotherapy/ chemoradiotherapy)
(MDT discussion, pretreatment chest imaging / dental assessment)
ll larynx, oral cavity, oropharynx, hypopharynx, nasopharynx, major
A
salivary gland diagnoses in audit year with England first treatment
not biopsy (surgery/ radiotherapy/ chemotherapy/ chemoradiotherapy)
(Pretreatment CNS / SALT / nutritional assessment and 6 indicator ideal pathway)
ll larynx, oral cavity, oropharynx, hypopharynx, nasopharynx, major
A
salivary gland diagnoses in audit year with England first treatment as
surgery (non-palliative)
(Resective pathology discussed at MDT)
ll larynx, oral cavity, oropharynx, hypopharynx, nasopharynx, major
A
salivary gland diagnoses in audit year with England first treatment not
biopsy (surgery/ radiotherapy/ chemotherapy/ chemoradiotherapy)
and first treatment as surgery (non-palliative)
(7 indicator ideal patients pathway)
3 Counties
Percentage of (6 indicator)
patients pathway achieved
Percentage of (7 indicator)
patients pathway achieved
Current
Previous Difference
Audit Year Audit Year+
Resective Pathology
Discussed
(60.6%)
Pre-Treatment
CNS
(65.1%)
Discussed
at MDT
(100.0%)
Pre-Treatment
Nutrition
(34.2%)
!"
Pre-Treatment
Chest Imaging
(84.9%)
Pre-Treatment
SALT
(31.6%)
0
Current
Previous Difference
Audit Year Audit Year+
n
%
%
%
0
0.0
0.0
0.0
0
n
%
%
%
0
0.0
0.0
0.0
-7.2
1
9
5.9
9.7
-3.8
1
3
3.2
10.4
2
24
15.8
14.8
1.0
2
10
10.6
10.4
0.3
3
32
21.1
24.5
-3.5
3
27
28.7
24.5
4.2
4
49
32.2
25.2
7.1
4
24
25.5
24.5
1.0
5
16
10.5
9.0
1.5
5
25
26.6
14.2
12.4
6
22
14.5
16.8
-2.3
6
4
4.3
16.0
-11.8
7
1
1.1
0.0
1.1
94
100.0
100.0
Total
152
100.0
100.0
Total
Mean number of (6) key
aspects recorded
Pre-Treatment Dental
(53.3%)
Mean number of (7) key
aspects recorded
Current
Previous Difference
Audit Year Audit Year+
3.7
Anglia
3.6
Current
Previous Difference
Audit Year Audit Year+
0.1
3.8
Percentage of (6 indicator)
patients pathway achieved
Pre-Treatment
CNS
(56.5%)
Discussed
at MDT
(95.8%)
Pre-Treatment
Nutrition
(36.7%)
!"
Pre-Treatment
Chest Imaging
(87.1%)
Pre-Treatment
SALT
(36.0%)
Pre-Treatment Dental
(55.2%)
0
0.1
Percentage of (7 indicator)
patients pathway achieved
Current
Previous Difference
Audit Year Audit Year+
Resective Pathology
Discussed
(67.7%)
3.7
n
%
%
%
1
0.3
0.4
0.0
Current
Previous Difference
Audit Year Audit Year+
0
n
%
%
%
0
0.0
0.7
-0.7
1
16
5.2
23.4
-18.2
1
7
4.4
36.1
-31.7
2
49
15.9
26.6
-10.7
2
15
9.4
29.2
-19.7
3
85
27.6
23.4
4.2
3
29
18.2
12.5
5.7
4
67
21.8
11.7
10.1
4
43
27.0
11.8
15.2
5
45
14.6
11.7
2.9
5
24
15.1
6.9
8.1
6
45
14.6
2.9
11.7
6
22
13.8
2.8
11.1
11.9
308
100.0
100.0
7
Total
Total
Mean number of (6) key
aspects recorded
2.7
11.9
0.0
100.0
100.0
Mean number of (7) key
aspects recorded
Current
Previous Difference
Audit Year Audit Year+
3.7
19
159
1.0
Current
Previous Difference
Audit Year Audit Year+
4.3
2.3
2.0
Figure from 8AR
+ Chest imaging in 8AR did not include PET-CT; Pre-treatment CNS, dental, nutrition and SALT assessments in 8AR included surgery that may have been biopsy as first
treatment where recorded by trust.
Copyright © 2014, Health and Social Care Information Centre. All rights reserved.
Arden
Percentage of (6 indicator)
patients pathway achieved
Percentage of (7 indicator)
patients pathway achieved
Current
Previous Difference
Audit Year Audit Year+
Resective Pathology
Discussed
(95.1%)
Pre-Treatment
CNS
(77.1%)
Discussed
at MDT
(100.0%)
Pre-Treatment
Nutrition
(6.0%)
Pre-Treatment
Chest Imaging
(69.9%)
Pre-Treatment
SALT
(38.6%)
0
n
%
%
%
0
0.0
1.0
-1.0
Current
Previous Difference
Audit Year Audit Year+
n
%
%
%
0
0
0.0
0.0
0.0
-7.4
1
*
*
6.1
*
1
0
0.0
7.4
2
12
14.5
19.4
-4.9
2
*
*
9.3
*
3
33
39.8
21.4
18.3
3
9
22.0
27.8
-5.8
4
22
26.5
22.4
4.1
4
18
43.9
18.5
25.4
5
12
14.5
25.5
-11.1
5
10
24.4
18.5
5.9
6
*
*
4.1
*
6
*
*
14.8
*
7
*
*
3.7
*
41
100.0
100.0
Total
83
100.0
100.0
Total
Mean number of (6) key
aspects recorded
Pre-Treatment Dental
(45.8%)
Mean number of (7) key
aspects recorded
Current
Previous Difference
Audit Year Audit Year+
3.4
Avon, Somerset and Wiltshire
3.5
Current
Previous Difference
Audit Year Audit Year+
-0.1
4.0
Percentage of (6 indicator)
patients pathway achieved
Pre-Treatment
CNS
(56.8%)
Discussed
at MDT
(97.9%)
Pre-Treatment
Nutrition
(6.8%)
!"
Pre-Treatment
SALT
(16.5%)
Pre-Treatment
Chest Imaging
(62.7%)
0
n
%
%
%
2
0.8
0.5
0.4
Current
Previous Difference
Audit Year Audit Year+
0
n
%
%
%
1
0.7
0.7
0.0
1
45
19.1
28.5
-9.4
1
13
9.3
37.7
-28.4
2
58
24.6
28.5
-3.9
2
39
27.9
30.4
-2.6
3
65
27.5
23.5
4.0
3
28
20.0
18.8
1.2
4
42
17.8
15.4
2.4
4
35
25.0
9.4
15.6
5
24
10.2
3.6
6.5
5
17
12.1
2.2
10.0
6
0
0.0
0.0
0.0
6
7
5.0
0.7
4.3
7
0
0.0
0.0
0.0
140
100.0
100.0
Total
236
100.0
100.0
Total
Mean number of (6) key
aspects recorded
Pre-Treatment Dental
(32.2%)
Mean number of (7) key
aspects recorded
Current
Previous Difference
Audit Year Audit Year+
2.7
Central South Coast
2.4
Current
Previous Difference
Audit Year Audit Year+
0.4
3.2
Percentage of (6 indicator)
patients pathway achieved
Pre-Treatment
CNS
(80.0%)
Discussed
at MDT
(99.5%)
Pre-Treatment
Nutrition
(24.1%)
Pre-Treatment
Chest Imaging
(50.0%)
Pre-Treatment
SALT
(4.5%)
Pre-Treatment Dental
(47.7%)
2.1
1.1
Percentage of (7 indicator)
patients pathway achieved
Current
Previous Difference
Audit Year Audit Year+
Resective Pathology
Discussed
(69.8%)
0.1
Percentage of (7 indicator)
patients pathway achieved
Current
Previous Difference
Audit Year Audit Year+
Resective Pathology
Discussed
(66.4%)
3.9
Current
Previous Difference
Audit Year Audit Year+
n
%
%
%
0
0
0.0
1.0
-1.0
0
n
%
%
%
0
0.0
0.0
0.0
1
12
5.5
17.0
-11.5
1
2
80
36.4
48.1
-11.7
2
4
3.8
11.1
-7.3
29
27.4
20.6
3
51
23.2
20.9
2.3
3
13
6.7
12.3
31.7
-19.5
4
45
20.5
8.7
11.7
4
21
19.8
14.3
5.5
5
24
10.9
4.4
6.5
5
24
22.6
15.9
6.8
6
8
3.6
0.0
3.6
6
11
10.4
6.3
4.0
7
4
3.8
0.0
3.8
106
100.0
100.0
Total
220
100.0
100.0
Total
Mean number of (6) key
aspects recorded
Mean number of (7) key
aspects recorded
Current
Previous Difference
Audit Year Audit Year+
3.1
2.3
0.7
Current
Previous Difference
Audit Year Audit Year+
3.8
3.2
0.5
Figure from 8AR
+ Chest imaging in 8AR did not include PET-CT; Pre-treatment CNS, dental, nutrition and SALT assessments in 8AR included surgery that may have been biopsy as first
treatment where recorded by trust.
* (asterisk) in cell table = small numbers between 1-4 [primary suppression] or another number (including zero) selected for secondary suppression (i.e. to ensure that the
primary suppression cannot be derived by subtraction). Associated percentages have also been suppressed to ensure that the suppressed number cannot be derived
from the percentage.
Copyright © 2014, Health and Social Care Information Centre. All rights reserved.
Dorset
Percentage of (6 indicator)
patients pathway achieved
Percentage of (7 indicator)
patients pathway achieved
Current
Previous Difference
Audit Year Audit Year+
Resective Pathology
Discussed
(100.0%)
Pre-Treatment
CNS
(80.2%)
Discussed
at MDT
(100.0%)
Pre-Treatment
Nutrition
(35.3%)
!"
Pre-Treatment
Chest Imaging
(91.4%)
Pre-Treatment
SALT
(11.2%)
0
n
%
%
%
0
0.0
0.0
0.0
Current
Previous Difference
Audit Year Audit Year+
n
%
%
%
0
0
0.0
0.0
0.0
0.0
1
*
*
3.8
*
1
0
0.0
0.0
2
16
13.8
8.6
5.2
2
*
*
10.0
*
3
19
16.4
25.7
-9.3
3
11
20.0
12.5
7.5
4
37
31.9
36.2
-4.3
4
11
20.0
32.5
-12.5
5
35
30.2
23.8
6.4
5
13
23.6
27.5
-3.9
6
*
*
1.9
*
6
12
21.8
15.0
6.8
7
*
*
2.5
*
55
100.0
100.0
Total
116
100.0
100.0
Total
Mean number of (6) key
aspects recorded
Pre-Treatment Dental
(62.1%)
Mean number of (7) key
aspects recorded
Current
Previous Difference
Audit Year Audit Year+
3.8
East Midlands
3.7
Current
Previous Difference
Audit Year Audit Year+
0.1
4.5
Percentage of (6 indicator)
patients pathway achieved
Pre-Treatment
CNS
(64.7%)
Discussed
at MDT
(99.1%)
Pre-Treatment
Nutrition
(25.7%)
!"
Pre-Treatment
SALT
(9.8%)
Pre-Treatment
Chest Imaging
(58.8%)
0
Current
Previous Difference
Audit Year Audit Year+
n
%
%
%
2
0.4
0.3
0.2
0
n
%
%
%
1
0.3
0.4
-0.1
1
61
13.5
16.7
-3.2
1
28
9.6
7.5
2.1
2
135
29.9
27.1
2.9
2
56
19.2
19.6
-0.4
3
145
32.2
37.9
-5.8
3
92
31.5
39.2
-7.7
4
65
14.4
14.9
-0.4
4
73
25.0
25.4
-0.4
5
38
8.4
3.2
5.2
5
29
9.9
6.7
3.3
6
5
1.1
0.0
1.1
6
11
3.8
1.3
2.5
7
2
0.7
0.0
0.7
292
100.0
100.0
Total
451
100.0
100.0
Total
Mean number of (6) key
aspects recorded
Pre-Treatment Dental
(18.2%)
Mean number of (7) key
aspects recorded
Current
Previous Difference
Audit Year Audit Year+
2.8
Essex
2.6
Current
Previous Difference
Audit Year Audit Year+
0.2
3.2
Percentage of (6 indicator)
patients pathway achieved
Pre-Treatment
CNS
(63.4%)
Discussed
at MDT
(100.0%)
Pre-Treatment
Nutrition
(39.4%)
!"
Pre-Treatment
Chest Imaging
(96.5%)
Pre-Treatment
SALT
(33.1%)
Pre-Treatment Dental
(66.9%)
0
3.1
0.1
Percentage of (7 indicator)
patients pathway achieved
Current
Previous Difference
Audit Year Audit Year+
Resective Pathology
Discussed
(82.6%)
0.2
Percentage of (7 indicator)
patients pathway achieved
Current
Previous Difference
Audit Year Audit Year+
Resective Pathology
Discussed
(72.3%)
4.3
n
%
%
%
0
0.0
0.0
0.0
Current
Previous Difference
Audit Year Audit Year+
0
n
%
%
%
0
0.0
0.0
0.0
1
2
1.4
0.0
1.4
1
2
2.9
0.0
2.9
2
22
15.5
6.5
9.0
2
2
2.9
3.5
-0.6
3
39
27.5
20.1
7.3
3
7
10.1
11.6
-1.5
4
21
14.8
34.4
-19.6
4
32
46.4
23.3
23.1
5
28
19.7
24.7
-5.0
5
9
13.0
33.7
-20.7
6
30
21.1
14.3
6.8
6
4
5.8
16.3
-10.5
7.2
142
100.0
100.0
Total
Mean number of (6) key
aspects recorded
4.2
13
18.8
11.6
69
100.0
100.0
Mean number of (7) key
aspects recorded
Current
Previous Difference
Audit Year Audit Year+
4.0
7
Total
-0.2
Current
Previous Difference
Audit Year Audit Year+
4.6
4.8
-0.3
Figure from 8AR
+ Chest imaging in 8AR did not include PET-CT; Pre-treatment CNS, dental, nutrition and SALT assessments in 8AR included surgery that may have been biopsy as first
treatment where recorded by trust.
* (asterisk) in cell table = small numbers between 1-4 [primary suppression] or another number (including zero) selected for secondary suppression (i.e. to ensure that the
primary suppression cannot be derived by subtraction). Associated percentages have also been suppressed to ensure that the suppressed number cannot be derived
from the percentage.
Copyright © 2014, Health and Social Care Information Centre. All rights reserved.
Greater Manchester and Cheshire
Percentage of (6 indicator)
patients pathway achieved
Percentage of (7 indicator)
patients pathway achieved
Current
Previous Difference
Audit Year Audit Year+
Resective Pathology
Discussed
(18.9%)
Pre-Treatment
CNS
(53.2%)
Discussed
at MDT
(93.3%)
Pre-Treatment
Nutrition
(23.3%)
!"
Pre-Treatment
Chest Imaging
(49.1%)
Pre-Treatment
SALT
(17.6%)
0
n
%
%
%
13
3.4
5.1
-1.7
Current
Previous Difference
Audit Year Audit Year+
0
n
%
%
%
9
3.7
6.2
-2.5
1
72
18.6
19.9
-1.3
1
36
14.9
12.4
2.4
2
138
35.7
46.4
-10.8
2
82
33.9
15.5
18.3
3
94
24.3
22.0
2.3
3
72
29.8
38.9
-9.1
4
53
13.7
1.8
11.9
4
34
14.0
19.2
-5.1
5
16
4.1
3.9
0.3
5
8
3.3
2.6
0.7
6
1
0.3
0.9
-0.6
6
1
0.4
4.1
-3.7
-1.0
387
100.0
100.0
7
Total
Total
0
0.0
1.0
242
100.0
100.0
Mean number of (6) key
aspects recorded
Pre-Treatment Dental
(3.1%)
Mean number of (7) key
aspects recorded
Current
Previous Difference
Audit Year Audit Year+
2.4
Greater Midlands
2.1
Current
Previous Difference
Audit Year Audit Year+
0.3
2.5
Percentage of (6 indicator)
patients pathway achieved
Pre-Treatment
CNS
(83.4%)
Discussed
at MDT
(93.0%)
Pre-Treatment
Nutrition
(29.5%)
!"
Pre-Treatment
SALT
(27.4%)
Pre-Treatment
Chest Imaging
(71.7%)
Current
Previous Difference
Audit Year Audit Year+
n
%
%
%
n
%
%
%
0
5
2.1
0.8
1.3
0
4
3.1
1.5
1.5
1
20
8.3
4.8
3.5
1
10
7.6
5.3
2.3
2
35
14.5
14.0
0.5
2
23
17.6
10.7
6.9
3
34
14.1
24.8
-10.7
3
31
23.7
21.4
2.3
4
69
28.6
19.2
9.4
4
13
9.9
17.6
-7.6
5
53
22.0
31.6
-9.6
5
20
15.3
13.0
2.3
6
25
10.4
4.8
5.6
6
22
16.8
26.7
-9.9
2.3
241
100.0
100.0
7
Total
Total
8
6.1
3.8
131
100.0
100.0
Mean number of (6) key
aspects recorded
Pre-Treatment Dental
(60.6%)
Mean number of (7) key
aspects recorded
Current
Previous Difference
Audit Year Audit Year+
3.7
Humber and Yorkshire Coast
3.7
Current
Previous Difference
Audit Year Audit Year+
0.0
3.7
Percentage of (6 indicator)
patients pathway achieved
Pre-Treatment
CNS
(64.2%)
Discussed
at MDT
(95.6%)
Pre-Treatment
Nutrition
(22.6%)
!"
Pre-Treatment
Chest Imaging
(47.4%)
Pre-Treatment
SALT
(10.9%)
Pre-Treatment Dental
(16.1%)
0
4.1
-0.4
Percentage of (7 indicator)
patients pathway achieved
Current
Previous Difference
Audit Year Audit Year+
Resective Pathology
Discussed
(36.3%)
-0.3
Percentage of (7 indicator)
patients pathway achieved
Current
Previous Difference
Audit Year Audit Year+
Resective Pathology
Discussed
(50.0%)
2.8
Current
Previous Difference
Audit Year Audit Year+
n
%
%
%
n
%
%
%
1
0.7
0.0
0.7
0
0
0.0
0.0
0.0
10.4
1
25
18.2
19.3
-1.0
1
18
19.8
9.4
2
46
33.6
44.3
-10.7
2
30
33.0
28.2
4.7
3
36
26.3
22.1
4.1
3
26
28.6
34.1
-5.5
4
20
14.6
11.4
3.2
4
10
11.0
16.5
-5.5
5
7
5.1
2.9
2.3
5
6
6.6
10.6
-4.0
6
2
1.5
0.0
1.5
6
1
1.1
1.2
-0.1
7
0
0.0
0.0
0.0
91
100.0
100.0
Total
137
100.0
100.0
Total
Mean number of (6) key
aspects recorded
Mean number of (7) key
aspects recorded
Current
Previous Difference
Audit Year Audit Year+
2.6
2.3
0.2
Current
Previous Difference
Audit Year Audit Year+
2.5
2.9
-0.4
Figure from 8AR
+ Chest imaging in 8AR did not include PET-CT; Pre-treatment CNS, dental, nutrition and SALT assessments in 8AR included surgery that may have been biopsy as first
treatment where recorded by trust.
Copyright © 2014, Health and Social Care Information Centre. All rights reserved.
Kent and Medway
Percentage of (6 indicator)
patients pathway achieved
Percentage of (7 indicator)
patients pathway achieved
Current
Previous Difference
Audit Year Audit Year+
Resective Pathology
Discussed
(48.4%)
Pre-Treatment
CNS
(40.7%)
Discussed
at MDT
(99.5%)
Pre-Treatment
Nutrition
(11.0%)
!"
Pre-Treatment
Chest Imaging
(41.9%)
Pre-Treatment
SALT
(1.0%)
Current
Previous Difference
Audit Year Audit Year+
n
%
%
%
n
%
%
%
0
0
0.0
8.2
-8.2
0
0
0.0
1.0
-1.0
1
106
50.7
30.9
19.8
1
55
46.6
6.0
40.6
2
28
13.4
42.8
-29.4
2
9
7.6
54.0
-46.4
3
57
27.3
8.8
18.5
3
14
11.9
9.0
2.9
4
14
6.7
7.7
-1.0
4
22
18.6
17.0
1.6
5
4
1.9
1.0
0.9
5
14
11.9
11.0
0.9
6
0
0.0
0.5
-0.5
6
4
3.4
1.0
2.4
7
0
0.0
1.0
-1.0
118
100.0
100.0
Total
209
100.0
100.0
Total
Mean number of (6) key
aspects recorded
Pre-Treatment Dental
(2.4%)
Mean number of (7) key
aspects recorded
Current
Previous Difference
Audit Year Audit Year+
2.0
Lancashire and South Cumbria
1.8
Current
Previous Difference
Audit Year Audit Year+
0.1
2.5
Percentage of (6 indicator)
patients pathway achieved
Pre-Treatment
CNS
(55.4%)
Discussed
at MDT
(60.7%)
Pre-Treatment
Nutrition
(11.2%)
!"
Pre-Treatment
SALT
(27.3%)
Pre-Treatment
Chest Imaging
(54.5%)
0
n
%
%
%
47
19.4
4.5
14.9
Current
Previous Difference
Audit Year Audit Year+
0
n
%
%
%
30
15.9
2.1
13.8
1
52
21.5
31.1
-9.6
1
37
19.6
33.3
-13.8
2
51
21.1
29.0
-7.9
2
34
18.0
28.7
-10.7
3
23
9.5
23.4
-13.9
3
29
15.3
15.9
-0.6
4
27
11.2
6.3
4.9
4
18
9.5
13.8
-4.3
5
29
12.0
5.2
6.7
5
19
10.1
5.6
4.4
6
13
5.4
0.3
5.0
6
22
11.6
0.5
11.1
0.0
242
100.0
100.0
7
Total
Total
0
0.0
0.0
189
100.0
100.0
Mean number of (6) key
aspects recorded
Pre-Treatment Dental
(19.8%)
Mean number of (7) key
aspects recorded
Current
Previous Difference
Audit Year Audit Year+
2.3
London Cancer Alliance
2.1
Current
Previous Difference
Audit Year Audit Year+
0.2
2.6
Percentage of (6 indicator)
patients pathway achieved
Pre-Treatment
CNS
(68.7%)
Discussed
at MDT
(94.8%)
Pre-Treatment
Nutrition
(43.2%)
!"
Pre-Treatment
Chest Imaging
(73.3%)
Pre-Treatment
SALT
(45.3%)
Pre-Treatment Dental
(20.9%)
2.3
0.3
Percentage of (7 indicator)
patients pathway achieved
Current
Previous Difference
Audit Year Audit Year+
Resective Pathology
Discussed
(85.2%)
-0.3
Percentage of (7 indicator)
patients pathway achieved
Current
Previous Difference
Audit Year Audit Year+
Resective Pathology
Discussed
(52.9%)
2.8
Current
Previous Difference
Audit Year Audit Year+
n
%
%
%
0
3
0.6
0.9
-0.3
0
n
%
%
%
1
0.4
0.0
0.4
1
31
6.5
15.2
-8.7
1
5
2
80
16.7
47.1
-30.4
2
31
1.8
3.9
-2.1
11.4
17.1
3
143
29.9
15.6
14.2
3
57
21.0
-5.7
43.4
-22.4
4
101
21.1
12.9
8.2
4
58
21.4
11.4
10.0
5
92
19.2
6.3
12.9
5
48
17.7
11.4
6.3
6
29
6.1
2.0
4.0
6
50
18.5
9.2
9.2
7
21
7.7
3.5
4.2
271
100.0
100.0
Total
479
100.0
100.0
Total
Mean number of (6) key
aspects recorded
Mean number of (7) key
aspects recorded
Current
Previous Difference
Audit Year Audit Year+
3.5
2.5
0.9
Current
Previous Difference
Audit Year Audit Year+
4.3
3.5
0.8
Figure from 8AR
+ Chest imaging in 8AR did not include PET-CT; Pre-treatment CNS, dental, nutrition and SALT assessments in 8AR included surgery that may have been biopsy as first
treatment where recorded by trust.
Copyright © 2014, Health and Social Care Information Centre. All rights reserved.
London Cancer
Percentage of (6 indicator)
patients pathway achieved
Percentage of (7 indicator)
patients pathway achieved
Current
Previous Difference
Audit Year Audit Year+
Resective Pathology
Discussed
(60.9%)
Pre-Treatment
CNS
(67.6%)
Discussed
at MDT
(90.2%)
Pre-Treatment
Nutrition
(26.8%)
!"
Pre-Treatment
Chest Imaging
(47.7%)
Pre-Treatment
SALT
(29.6%)
Current
Previous Difference
Audit Year Audit Year+
n
%
%
%
n
%
%
%
0
6
2.1
1.1
1.0
0
6
3.0
0.5
2.5
1
25
8.7
22.1
-13.4
1
13
6.6
8.2
-1.6
2
60
20.9
21.0
-0.1
2
27
13.7
19.8
-6.1
3
97
33.8
23.8
10.0
3
48
24.4
24.2
0.2
4
51
17.8
9.3
8.5
4
59
29.9
19.2
10.7
5
29
10.1
9.3
0.9
5
29
14.7
9.3
5.4
6
19
6.6
13.5
-6.9
6
7
3.6
7.7
-4.1
-6.9
287
100.0
100.0
7
Total
Total
8
4.1
11.0
197
100.0
100.0
Mean number of (6) key
aspects recorded
Pre-Treatment Dental
(51.2%)
Mean number of (7) key
aspects recorded
Current
Previous Difference
Audit Year Audit Year+
3.1
Merseyside and Cheshire
3.0
Current
Previous Difference
Audit Year Audit Year+
0.1
3.5
Percentage of (6 indicator)
patients pathway achieved
Pre-Treatment
CNS
(33.2%)
Discussed
at MDT
(98.3%)
Pre-Treatment
Nutrition
(18.7%)
!"
Pre-Treatment
SALT
(0.6%)
Pre-Treatment
Chest Imaging
(78.2%)
0
n
%
%
%
0
0.0
3.8
-3.8
Current
Previous Difference
Audit Year Audit Year+
0
n
%
%
%
0
0.0
4.4
-4.4
1
64
18.7
37.9
-19.3
1
53
22.6
43.8
-21.1
2
150
43.7
37.4
6.3
2
117
50.0
37.2
12.8
3
92
26.8
17.4
9.4
3
51
21.8
13.1
8.7
4
36
10.5
3.1
7.4
4
10
4.3
1.1
3.2
5
1
0.3
0.3
0.0
5
3
1.3
0.4
0.9
6
0
0.0
0.0
0.0
6
0
0.0
0.0
0.0
7
0
0.0
0.0
0.0
234
100.0
100.0
Total
343
100.0
100.0
Total
Mean number of (6) key
aspects recorded
Pre-Treatment Dental
(0.9%)
Mean number of (7) key
aspects recorded
Current
Previous Difference
Audit Year Audit Year+
2.3
Mount Vernon
1.8
Current
Previous Difference
Audit Year Audit Year+
0.5
2.1
Percentage of (6 indicator)
patients pathway achieved
Pre-Treatment
CNS
(70.9%)
Discussed
at MDT
(90.1%)
Pre-Treatment
Nutrition
(25.5%)
!"
Pre-Treatment
Chest Imaging
(56.7%)
Pre-Treatment
SALT
(16.3%)
Pre-Treatment Dental
(13.5%)
0
1.6
0.5
Percentage of (7 indicator)
patients pathway achieved
Current
Previous Difference
Audit Year Audit Year+
Resective Pathology
Discussed
(44.0%)
-0.2
Percentage of (7 indicator)
patients pathway achieved
Current
Previous Difference
Audit Year Audit Year+
Resective Pathology
Discussed
(3.8%)
3.7
n
%
%
%
4
2.8
1.0
1.9
Current
Previous Difference
Audit Year Audit Year+
0
n
%
%
%
1
1.3
0.0
1.3
1
20
14.2
17.1
-3.0
1
8
10.7
17.0
-6.4
2
32
22.7
35.2
-12.5
2
16
21.3
19.1
2.2
3
50
35.5
24.8
10.7
3
26
34.7
31.9
2.8
4
25
17.7
21.0
-3.2
4
18
24.0
23.4
0.6
5
9
6.4
1.0
5.4
5
3
4.0
6.4
-2.4
6
1
0.7
0.0
0.7
6
3
4.0
2.1
1.9
7
0
0.0
0.0
0.0
75
100.0
100.0
Total
141
100.0
100.0
Total
Mean number of (6) key
aspects recorded
Mean number of (7) key
aspects recorded
Current
Previous Difference
Audit Year Audit Year+
2.7
2.5
0.2
Current
Previous Difference
Audit Year Audit Year+
3.0
2.9
0.1
Figure from 8AR
+ Chest imaging in 8AR did not include PET-CT; Pre-treatment CNS, dental, nutrition and SALT assessments in 8AR included surgery that may have been biopsy as first
treatment where recorded by trust.
Copyright © 2014, Health and Social Care Information Centre. All rights reserved.
North of England
Percentage of (6 indicator)
patients pathway achieved
Percentage of (7 indicator)
patients pathway achieved
Current
Previous Difference
Audit Year Audit Year+
Resective Pathology
Discussed
(75.8%)
Pre-Treatment
CNS
(78.9%)
Discussed
at MDT
(99.5%)
Pre-Treatment
Nutrition
(46.6%)
!"
Pre-Treatment
Chest Imaging
(82.6%)
Pre-Treatment
SALT
(49.4%)
0
Current
Previous Difference
Audit Year Audit Year+
n
%
%
%
1
0.2
0.9
-0.7
0
n
%
%
%
1
0.4
0.7
-0.3
1
9
2.1
3.9
-1.8
1
5
2.0
4.7
-2.7
2
43
10.0
19.7
-9.7
2
16
6.3
19.9
-13.6
-12.1
3
64
14.8
25.5
-10.6
3
41
16.0
28.2
4
106
24.6
17.8
6.8
4
61
23.8
21.3
2.5
5
118
27.4
19.7
7.7
5
59
23.0
9.0
14.0
6
90
20.9
12.5
8.4
6
44
17.2
12.6
4.6
7
29
11.3
3.6
7.7
256
100.0
100.0
Total
431
100.0
100.0
Total
Mean number of (6) key
aspects recorded
Pre-Treatment Dental
(70.1%)
Mean number of (7) key
aspects recorded
Current
Previous Difference
Audit Year Audit Year+
4.3
North Trent
3.6
Current
Previous Difference
Audit Year Audit Year+
0.6
4.6
Percentage of (6 indicator)
patients pathway achieved
Pre-Treatment
CNS
(53.5%)
Discussed
at MDT
(100.0%)
Pre-Treatment
Nutrition
(20.5%)
!"
Pre-Treatment
SALT
(28.8%)
Pre-Treatment
Chest Imaging
(86.5%)
0
n
%
%
%
0
0.0
0.0
0.0
Current
Previous Difference
Audit Year Audit Year+
0
n
%
%
%
0
0.0
0.0
0.0
0.0
1
15
7.0
2.6
4.4
1
0
0.0
0.0
2
49
22.8
26.2
-3.4
2
8
6.4
3.7
2.7
3
67
31.2
34.0
-2.9
3
36
28.8
31.2
-2.4
4
43
20.0
32.5
-12.5
4
39
31.2
27.5
3.7
5
36
16.7
4.7
12.0
5
22
17.6
33.0
-15.4
6
5
2.3
0.0
2.3
6
18
14.4
4.6
9.8
7
2
1.6
0.0
1.6
125
100.0
100.0
Total
215
100.0
100.0
Total
Mean number of (6) key
aspects recorded
Pre-Treatment Dental
(34.4%)
Mean number of (7) key
aspects recorded
Current
Previous Difference
Audit Year Audit Year+
3.2
Pan Birmingham
3.1
Current
Previous Difference
Audit Year Audit Year+
0.1
4.1
Percentage of (6 indicator)
patients pathway achieved
Pre-Treatment
CNS
(57.3%)
Discussed
at MDT
(87.3%)
Pre-Treatment
Nutrition
(27.3%)
!"
Pre-Treatment
Chest Imaging
(83.6%)
Pre-Treatment
SALT
(29.1%)
Pre-Treatment Dental
(37.3%)
4.0
0.1
Percentage of (7 indicator)
patients pathway achieved
Current
Previous Difference
Audit Year Audit Year+
Resective Pathology
Discussed
(72.4%)
1.0
Percentage of (7 indicator)
patients pathway achieved
Current
Previous Difference
Audit Year Audit Year+
Resective Pathology
Discussed
(94.4%)
3.6
Current
Previous Difference
Audit Year Audit Year+
n
%
%
%
0
0
0.0
6.8
-6.8
0
n
%
%
%
0
0.0
0.8
-0.8
1
14
12.7
21.0
-8.2
1
1
2
28
25.5
18.5
6.9
2
12
1.7
8.5
-6.8
20.7
23.7
3
20
18.2
35.6
-17.4
3
13
-3.0
22.4
50.0
-27.6
15.7
4
22
20.0
16.1
3.9
4
16
27.6
11.9
5
20
18.2
1.5
16.7
5
8
13.8
5.1
8.7
6
6
5.5
0.5
5.0
6
8
13.8
0.0
13.8
0.0
110
100.0
100.0
7
Total
Total
Mean number of (6) key
aspects recorded
2.4
0.0
0.0
100.0
100.0
Mean number of (7) key
aspects recorded
Current
Previous Difference
Audit Year Audit Year+
3.2
0
58
0.8
Current
Previous Difference
Audit Year Audit Year+
3.7
2.8
0.9
Figure from 8AR
+ Chest imaging in 8AR did not include PET-CT; Pre-treatment CNS, dental, nutrition and SALT assessments in 8AR included surgery that may have been biopsy as first
treatment where recorded by trust.
Copyright © 2014, Health and Social Care Information Centre. All rights reserved.
Peninsula
Percentage of (6 indicator)
patients pathway achieved
Percentage of (7 indicator)
patients pathway achieved
Current
Previous Difference
Audit Year Audit Year+
Resective Pathology
Discussed
(50.4%)
Pre-Treatment
CNS
(64.2%)
Discussed
at MDT
(96.9%)
Pre-Treatment
Nutrition
(52.7%)
!"
Pre-Treatment
Chest Imaging
(67.3%)
Pre-Treatment
SALT
(50.9%)
0
n
%
%
%
2
0.9
1.3
-0.4
Current
Previous Difference
Audit Year Audit Year+
0
%
%
%
2
1.7
2.0
-0.3
1
20
8.8
20.5
-11.7
1
10
8.4
20.1
-11.7
2
34
15.0
19.7
-4.6
2
25
21.0
24.2
-3.2
3
38
16.8
19.2
-2.4
3
21
17.6
9.4
8.3
4
48
21.2
18.8
2.4
4
18
15.1
18.1
-3.0
5
47
20.8
14.1
6.7
5
22
18.5
10.7
7.7
6
37
16.4
6.4
10.0
6
14
11.8
9.4
2.4
7
7
5.9
6.0
-0.2
119
100.0
100.0
Total
226
100.0
100.0
Total
Mean number of (6) key
aspects recorded
Pre-Treatment Dental
(44.7%)
Mean number of (7) key
aspects recorded
Current
Previous Difference
Audit Year Audit Year+
3.8
Surrey, West Sussex and Hants
3.0
Current
Previous Difference
Audit Year Audit Year+
0.7
3.7
Percentage of (6 indicator)
patients pathway achieved
Pre-Treatment
CNS
(93.6%)
Discussed
at MDT
(100.0%)
Pre-Treatment
Nutrition
(24.4%)
!"
Pre-Treatment
SALT
(19.9%)
Pre-Treatment
Chest Imaging
(89.7%)
Current
Previous Difference
Audit Year Audit Year+
n
%
%
%
n
%
%
%
0
0.0
0.6
-0.6
0
0
0.0
1.2
-1.2
1
9
5.8
7.5
-1.7
1
0
0.0
1.2
-1.2
2
6
3.8
6.2
-2.4
2
9
13.4
13.4
0.0
3
65
41.7
9.3
32.3
3
7
10.4
11.0
-0.5
39.9
4
39
25.0
18.0
7.0
4
39
58.2
18.3
5
32
20.5
36.0
-15.5
5
11
16.4
14.6
1.8
6
5
3.2
22.4
-19.2
6
1
1.5
30.5
-29.0
-9.8
156
100.0
100.0
7
Total
Total
0
0.0
9.8
67
100.0
100.0
Mean number of (6) key
aspects recorded
Mean number of (7) key
aspects recorded
Current
Previous Difference
Audit Year Audit Year+
3.6
Sussex
4.3
Current
Previous Difference
Audit Year Audit Year+
-0.7
3.8
Percentage of (6 indicator)
patients pathway achieved
Discussed
at MDT
(99.0%)
Pre-Treatment
Nutrition
(49.5%)
!"
Pre-Treatment
Chest Imaging
(66.0%)
Pre-Treatment
SALT
(36.4%)
Pre-Treatment Dental
(7.1%)
4.6
-0.8
Percentage of (7 indicator)
patients pathway achieved
Current
Previous Difference
Audit Year Audit Year+
Pre-Treatment
CNS
(72.7%)
0.5
0
Pre-Treatment Dental
(32.7%)
Resective Pathology
Discussed
(65.3%)
3.2
Percentage of (7 indicator)
patients pathway achieved
Current
Previous Difference
Audit Year Audit Year+
Resective Pathology
Discussed
(98.5%)
n
n
%
%
%
0
0
0.0
0.0
0.0
Current
Previous Difference
Audit Year Audit Year+
0
n
%
%
%
0
0.0
0.0
0.0
-22.8
1
16
16.2
30.1
-13.9
1
7
9.5
32.2
2
9
9.1
12.6
-3.5
2
9
12.2
17.4
-5.2
3
22
22.2
16.1
6.1
3
15
20.3
9.1
11.2
4
32
32.3
23.1
9.2
4
15
20.3
19.8
0.4
5
20
20.2
17.5
2.7
5
22
29.7
19.0
10.7
6
0
0.0
0.7
-0.7
6
6
8.1
2.5
5.6
7
0
0.0
0.0
0.0
74
100.0
100.0
Total
99
100.0
100.0
Total
Mean number of (6) key
aspects recorded
Mean number of (7) key
aspects recorded
Current
Previous Difference
Audit Year Audit Year+
3.3
2.9
0.4
Current
Previous Difference
Audit Year Audit Year+
3.7
2.8
0.9
Figure from 8AR
+ Chest imaging in 8AR did not include PET-CT; Pre-treatment CNS, dental, nutrition and SALT assessments in 8AR included surgery that may have been biopsy as first
treatment where recorded by trust.
Copyright © 2014, Health and Social Care Information Centre. All rights reserved.
Thames Valley
Percentage of (6 indicator)
patients pathway achieved
Percentage of (7 indicator)
patients pathway achieved
Current
Previous Difference
Audit Year Audit Year+
Resective Pathology
Discussed
(50.0%)
Pre-Treatment
CNS
(68.5%)
Discussed
at MDT
(95.0%)
Pre-Treatment
Nutrition
(17.4%)
!"
Pre-Treatment
Chest Imaging
(68.9%)
Pre-Treatment
SALT
(11.8%)
Current
Previous Difference
Audit Year Audit Year+
n
%
%
%
0
4
2.2
0.5
1.7
0
1
24
13.5
15.5
-2.1
1
2
37
20.8
41.5
-20.7
2
3
69
38.8
31.6
7.2
3
34
4
32
18.0
8.3
9.7
4
35
5
11
6.2
2.6
3.6
5
19
6
1
0.6
0.0
0.6
6
7
118
Total
178
100.0
100.0
Total
n
%
%
%
4
3.4
0.8
2.6
9
7.6
13.5
-5.9
13
11.0
30.1
-19.1
28.8
27.8
1.0
29.7
24.1
5.6
16.1
2.3
13.8
3
2.5
1.5
1.0
1
0.8
0.0
0.8
100.0
100.0
Mean number of (6) key
aspects recorded
Pre-Treatment Dental
(15.7%)
Mean number of (7) key
aspects recorded
Current
Previous Difference
Audit Year Audit Year+
2.8
Yorkshire
2.4
Current
Previous Difference
Audit Year Audit Year+
0.4
3.4
Percentage of (6 indicator)
patients pathway achieved
Pre-Treatment
CNS
(74.6%)
Discussed
at MDT
(98.7%)
Pre-Treatment
Nutrition
(35.9%)
!"
Pre-Treatment
SALT
(38.2%)
Pre-Treatment
Chest Imaging
(66.8%)
Pre-Treatment Dental
(36.7%)
0
0.6
Percentage of (7 indicator)
patients pathway achieved
Current
Previous Difference
Audit Year Audit Year+
Resective Pathology
Discussed
(59.6%)
2.7
n
%
%
%
3
0.8
4.2
-3.4
Current
Previous Difference
Audit Year Audit Year+
0
n
%
%
%
2
0.9
2.9
-2.0
1
48
12.3
8.9
3.4
1
32
15.1
5.4
9.7
2
60
15.4
18.2
-2.8
2
29
13.7
15.5
-1.8
3
82
21.0
22.6
-1.6
3
44
20.8
20.5
0.3
4
75
19.2
17.1
2.1
4
34
16.0
27.2
-11.2
5
77
19.7
8.7
11.1
5
32
15.1
9.2
5.9
6
45
11.5
20.3
-8.7
6
25
11.8
5.9
5.9
-6.8
390
100.0
100.0
7
Total
Total
Mean number of (6) key
aspects recorded
3.5
6.6
13.4
100.0
100.0
Mean number of (7) key
aspects recorded
Current
Previous Difference
Audit Year Audit Year+
3.5
14
212
0.0
Current
Previous Difference
Audit Year Audit Year+
3.6
3.8
-0.2
Figure from 8AR
+ Chest imaging in 8AR did not include PET-CT; Pre-treatment CNS, dental, nutrition and SALT assessments in 8AR included surgery that may have been biopsy as first
treatment where recorded by trust.
Copyright © 2014, Health and Social Care Information Centre. All rights reserved.


