Percentage of North Carolina Adults Who Are Overweight or Obese
advertisement
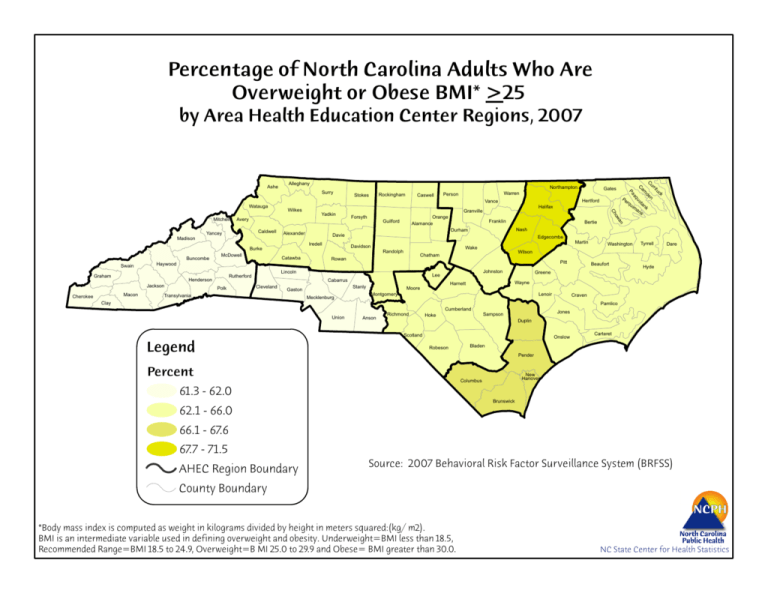
Percentage of North Carolina Adults Who Are Overweight or Obese BMI* >25 by Area Health Education Center Regions, 2007 Watauga Haywood Graham Cherokee Clay Macon Jackson Buncombe Henderson Transylvania McDowell Iredell Burke Catawba Lincoln Rutherford Polk Alexander Cleveland Gaston Forsyth Caswell Person Orange Alamance Guilford Davie Davidson Randolph Rowan Cabarrus Mecklenburg Union Montgomery Anson Granville Franklin Chatham Bertie Edgecombe Pitt Cumberland Robeson Percent Sampson Duplin Craven Jones Onslow Bladen im an ta en s Washington Tyrrell Dare Hyde Pamlico Carteret Pender New Hanover Columbus 61.3 - 62.0 qu Wayne Harnett Scotland Legend Pe r Beaufort Greene Lenoir Hoke Martin Wilson Johnston Moore Richmond Nash Durham C Gates Hertford Halifax Wake Lee Stanly Vance Northampton Warren n Swain Caldwell Yancey Yadkin Rockingham Stokes wa Madison Wilkes Avery Surry o Ch Mitchell Alleghany ck tu rri Cu d nk am uo sq Pa Ashe Brunswick 62.1 - 66.0 66.1 - 67.6 67.7 - 71.5 AHEC Region Boundary Source: 2007 Behavioral Risk Factor Surveillance System (BRFSS) County Boundary *Body mass index is computed as weight in kilograms divided by height in meters squared:(kg/ m2). BMI is an intermediate variable used in defining overweight and obesity. Underweight=BMI less than 18.5, Recommended Range=BMI 18.5 to 24.9, Overweight=B MI 25.0 to 29.9 and Obese= BMI greater than 30.0. NC State Center for Health Statistics
