Cell counting
advertisement
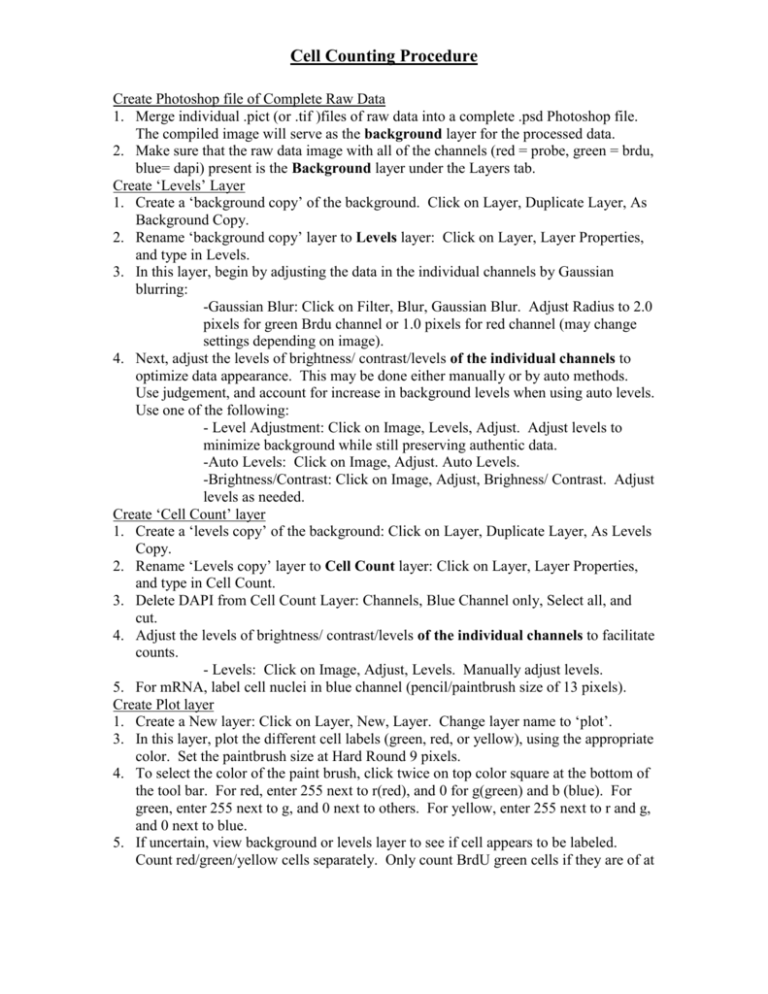
Cell Counting Procedure Create Photoshop file of Complete Raw Data 1. Merge individual .pict (or .tif )files of raw data into a complete .psd Photoshop file. The compiled image will serve as the background layer for the processed data. 2. Make sure that the raw data image with all of the channels (red = probe, green = brdu, blue= dapi) present is the Background layer under the Layers tab. Create ‘Levels’ Layer 1. Create a ‘background copy’ of the background. Click on Layer, Duplicate Layer, As Background Copy. 2. Rename ‘background copy’ layer to Levels layer: Click on Layer, Layer Properties, and type in Levels. 3. In this layer, begin by adjusting the data in the individual channels by Gaussian blurring: -Gaussian Blur: Click on Filter, Blur, Gaussian Blur. Adjust Radius to 2.0 pixels for green Brdu channel or 1.0 pixels for red channel (may change settings depending on image). 4. Next, adjust the levels of brightness/ contrast/levels of the individual channels to optimize data appearance. This may be done either manually or by auto methods. Use judgement, and account for increase in background levels when using auto levels. Use one of the following: - Level Adjustment: Click on Image, Levels, Adjust. Adjust levels to minimize background while still preserving authentic data. -Auto Levels: Click on Image, Adjust. Auto Levels. -Brightness/Contrast: Click on Image, Adjust, Brighness/ Contrast. Adjust levels as needed. Create ‘Cell Count’ layer 1. Create a ‘levels copy’ of the background: Click on Layer, Duplicate Layer, As Levels Copy. 2. Rename ‘Levels copy’ layer to Cell Count layer: Click on Layer, Layer Properties, and type in Cell Count. 3. Delete DAPI from Cell Count Layer: Channels, Blue Channel only, Select all, and cut. 4. Adjust the levels of brightness/ contrast/levels of the individual channels to facilitate counts. - Levels: Click on Image, Adjust, Levels. Manually adjust levels. 5. For mRNA, label cell nuclei in blue channel (pencil/paintbrush size of 13 pixels). Create Plot layer 1. Create a New layer: Click on Layer, New, Layer. Change layer name to ‘plot’. 3. In this layer, plot the different cell labels (green, red, or yellow), using the appropriate color. Set the paintbrush size at Hard Round 9 pixels. 4. To select the color of the paint brush, click twice on top color square at the bottom of the tool bar. For red, enter 255 next to r(red), and 0 for g(green) and b (blue). For green, enter 255 next to g, and 0 next to others. For yellow, enter 255 next to r and g, and 0 next to blue. 5. If uncertain, view background or levels layer to see if cell appears to be labeled. Count red/green/yellow cells separately. Only count BrdU green cells if they are of at Cell Counting Procedure least 3/4 size of a full size BrdU cell nucleus. To determine if a cell is doublelabeled, it must be labeled yellow of more than 1/2 of both green and red cells. 6. For ease of viewing plot, create a new ‘fill’ layer: Click Layer, New, Layer, and title it “fill”. Next, click on Edit, Fill. Make sure under Contents, Use ---, it is set to black. Click Ok. Create Grid layer 1. With all of the channels on (working in all of the channels), click on Cell Count layer. 2. Using the line tool, draw a straight line down center of area of the image that will be counted by holding down the shift key and dragging the tool across the image. This creates a new layer called ‘Shape 1’. 3. Rasterize the shape layer: click on layer, rasterize, layer. 4. Using the pencil/paintbrush, create a border at the top and bottom of the cortex (excluding meninges). Use DAPI stain as guide to cortex boundaries. 5. Create 10 bins by measuring the thickness of the cortex at each edge and on the center line and dividing by 10 in each case. Use line tool to draw bins. 6. In creating lines, sometimes several different ‘shape’ layers appear. To keep them as one layer, click on the second box (where the paintbrush is) of the additional layers to get links. Click on arrow above the Path and Layers Tabs; Merge linked. 7. Rename Shape layer to Grid layer: Click on Layer, Layer Properties, and type in Grid. Count! 1. Use NIH Image/Scion Image to do cell count (refer to NIH Image Procedure). 2. Enter data on sheet. For controls, record cortical layer as well as bin number. 3. Enter data into database. Area Measurement 1. Select Grid layer and copy to new image. Make sure dimensions are 1600x1200 and background is black. Save image as .tif file with identifying name (e.g. 12.5nlgrid.tif) 2. Open image in ImageJ and hit F3 to invert colors and set the proper scale. 3. Use magic wand to select an area of a bin and hit F1. Results window will pop up with area measurement. Select next part of bin and hit F1. Results window will add up areas to give the total area. 4. Once all areas have been measured, record total area for bin. (Record to 4 decimal places) 5. Press F2 to clear Results window and proceed to next bin. Cell Counting Procedure Five Layers of Cell Counting Background Layer Raw Data (unprocessed) Levels Layer Optimal brightness and contrast Cell Count Layer for actual cell counting Adjust levels for each channel 1. Blur 2. Set levels for high contrast (Thresholdlike) Plot Layer Plot of Labeled cells for counting Grid Layer (boundries at top and bottom of cortex, 10 bins) Draw cortex and bin boundrares
