Appendix: - Heriot
advertisement
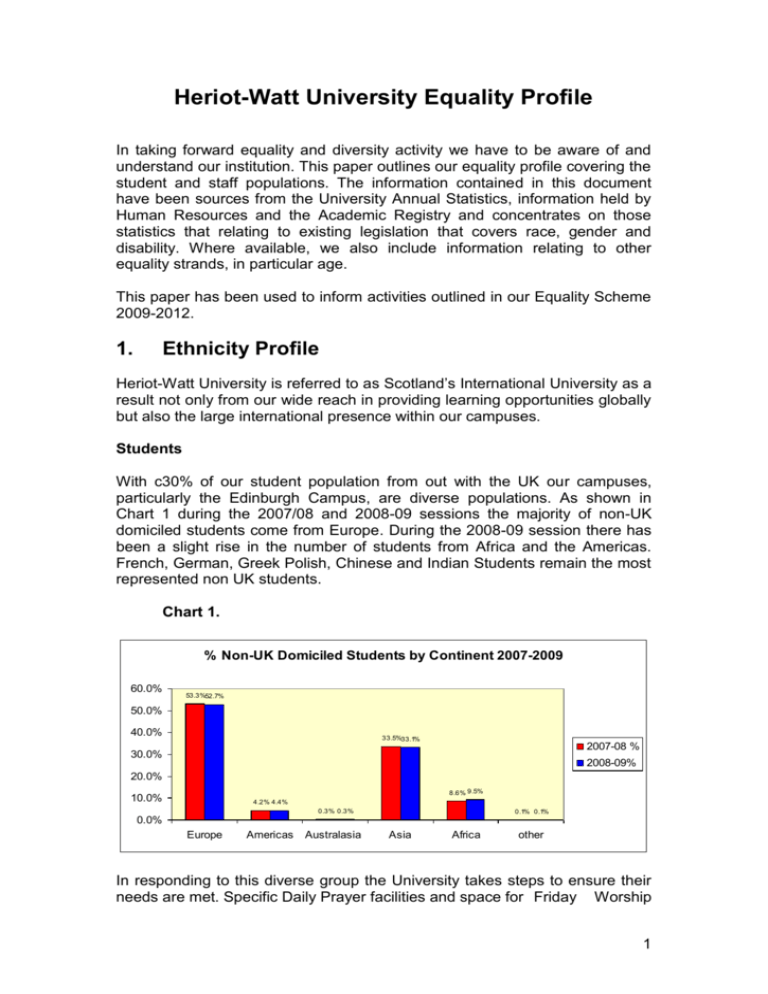
Heriot-Watt University Equality Profile In taking forward equality and diversity activity we have to be aware of and understand our institution. This paper outlines our equality profile covering the student and staff populations. The information contained in this document have been sources from the University Annual Statistics, information held by Human Resources and the Academic Registry and concentrates on those statistics that relating to existing legislation that covers race, gender and disability. Where available, we also include information relating to other equality strands, in particular age. This paper has been used to inform activities outlined in our Equality Scheme 2009-2012. 1. Ethnicity Profile Heriot-Watt University is referred to as Scotland’s International University as a result not only from our wide reach in providing learning opportunities globally but also the large international presence within our campuses. Students With c30% of our student population from out with the UK our campuses, particularly the Edinburgh Campus, are diverse populations. As shown in Chart 1 during the 2007/08 and 2008-09 sessions the majority of non-UK domiciled students come from Europe. During the 2008-09 session there has been a slight rise in the number of students from Africa and the Americas. French, German, Greek Polish, Chinese and Indian Students remain the most represented non UK students. Chart 1. % Non-UK Domiciled Students by Continent 2007-2009 60.0% 53.3%52.7% 50.0% 40.0% 33.5%33.1% 2007-08 % 30.0% 2008-09% 20.0% 8.6% 9.5% 10.0% 4.2% 4.4% 0.3% 0.3% 0.1% 0.1% 0.0% Europe Americas Australasia Asia Africa other In responding to this diverse group the University takes steps to ensure their needs are met. Specific Daily Prayer facilities and space for Friday Worship 1 ensures that our significant Muslim population is well catered for. In addition, we ensure our catering facilities meet the needs of this and other groups via a range of catering outlets and products. The majority of entrants to the University in session 2007-08 and 2008-09 where from White backgrounds, as shown in Chart 2. Within the broad headings of the chart, Black-African (Black), Pakistani and Chinese (Asian) were the most highly represented groups in both sessions. Further detailed information is available via the University Annual Statistics 2008-09 which can be found at www.hw.ac.uk/reference/annual_statistics.pdf Chart 2 Ethnicity of Entrants 2007-2009 100.0% 91.3% 92.7% 80.0% 60.0% 2007-2008 40.0% 2008-2009 20.0% 1.5% 1.1% 4.3% 4.6% 2.4% 1.5% 0.4% 0.4% 0.0% White Black Asian Mixed Other ethnic background Staff Our staff population is made up of academic and non academic staff, grouped under the following grade ranges; Professorial, Academic (non-professorial), Research, Academic/other Related, Secretarial/Clerical, Technical, Craft and Manual. As an international university based in Scotland there is diversity within our workforce and this differs within each of the staff groups. Overall, our staff population is c80% White. Chart 3 shows the ethnicity of our staff at December 2008. The chart also shows that just under 13% of our staff have either chosen not to record their ethnicity or the University does not hold this information. 2 Chart 3 Staff Ethnicity 2009 100% 79.8% 80% 60% Univeristy % of Total 40% 1.7% 2.7% 1.0% 0.2% 0.9% Asain/Asian British Chinese Other Asian Other Mixed Other Ethnic background 12.9% 0.8% Black/Black British 20% Not known/refused White 0% Chart 4 Staff Ethnicity by Grade Range December 2008 Not know n/refused Dubai Other Ethnic background EBS Other Mixed Craft and Manual Other Asian Technical Secretarial/Clerical Chinese Academic/Other Related Asain/Asian British Research Black/Black British Academic (all) White 0.0% 5.0% 10.0% 15.0% 20.0% 25.0% 30.0% Chart 4 illustrates in more depth the composition of our staff by grade ranges and includes Edinburgh Business School and the Dubai campus. This shows that across grades, the staff population is predominantly White. In addition, this chart shows that issues surrounding refusal to answer or missing data is spread across the grades. This information, along with our collection of disability related information shows a challenge for the University in accurate data collection and disclosure. Chart 5 continues this trend with again c12% of staff either not recorded or refusing to disclose their ethnicity. Chart 5 shows an overview of staff ethnicity in 2009, showing that our percentage of undisclosed staff ethnicity is higher than the percentage disclosing BME backgrounds. Disclosure across the equality strands has been highlighted as an area of significant activity by HWU. 3 Chart 5 Staff Ethnicity 2009 White Black, Minority Ethnic Not Stated 4 2. Gender Profile Heriot-Watt University offers a wide range of disciplines for study and research, along with comprehensive support systems for our student population. Overall the gender split within our student and staff populations is reasonably even, however, when we look at the statistics at a School or grade level there is a clearer picture of the spread of males and females within the University community. Students Our student population tends to be split along ‘traditional’ lines with a larger number of males undertaking science, engineering and technological areas of study. However, as our largest School is the School of Management and Languages and the School of Textiles and Design is almost 98% female, at the University wide level our gender split is quite even, as shown in Chart 6 which shows the percentage of full time and part time male and female students in sessions 2007-08 and 2008-09. Chart 6 % of Full and Part time Male and Female Students 07/08-08/09 100% 80% 60% Male 40% Female 20% Undergraduate Students Postgraduate Taught PT 08/09 PT 07/08 FT 08/09 FT 07/08 PT 08/09 PT 07/08 FT 08/09 FT 07/08 PT 08/09 PT 07/08 FT 08/09 FT 07/08 0% Postgraduate Research Degree Type Charts 7 – 12 still the information in Chart 6 to School level. Chart 7 shows the School of Built Environment for the session 2008-09. It shows that there is a much higher percentage of males than female in each programme of study. 5 Chart 7 % Male and Female UGs SBE 2008/09 100% 80% 60% 40% 20% 0% Male Female Full Time Part Time Architectural Full Time Part Time Civil Engineering Full Time Part Time Construction Full Time Part Time Urban Studies School of the Built Environment Chart 8 % Male and Female UGs SLS 08/09 100% 80% 60% Male 40% Female 20% 0% Full Time Part Time Biology Full Time Part Time Psychology Full Time Part Time Sport & Exercise School of Life Sciences Chart 8 shows that the School of Life Sciences has a more even spread of males and females across the School as a whole with c51% female full time students. This is a reflection of the subject areas offered within the School. Chart 9 shows the gender split within the School of Engineering and Physical Sciences. This is the School with the highest percentage of male students. The Chemistry programme has the highest percentage of females with just over 46% of the full time students’ female. 6 Chart 9 % Male and Female UGs EPS 08/09 100% 80% 60% 40% 20% 0% Male Female Full Part Time Time Full Part Time Time Full Part Time Time Full Part Time Time Full Part Time Time Full Part Time Time Chem Eng Chemistry Combined Studies Electrical, Electronic & Mechanical Engineering Physics School of Engineering and Physical Sciences The School of Engineering and Physical Sciences has the highest percentage of females within Chemistry, as shown above. The other programmes of study continue a significantly higher proportion of male undergraduates. Chart 10, below, shows that while the School of Management and Languages has a more even gender balance, some programmes of study retain a higher proportion of male undergraduates, particularly Economics and Accountancy and Finance. Languages, continue to have a higher percentage of females. Chart 10 % Male and Female UGs SML 08/09 100% 80% 60% Male 40% Female 20% 0% Full Time Part Time Accountancy & Finance Full Time Part Time Combined Studies Full Time Part Time Economics Full Time Part Time Languages Full Time Part Time M anagement Full Time Part Time M anagement (SBC) Full Time Part Time M anagement (Link) Full Time Part Time Foundation Eng/Interpret. School of M anagement and Languages 7 Chart 11 % Male and Female UGs MACs 08/09 100% 80% Male 60% 40% Female 20% 0% Full Time Part Time Full Time Actuarial Mathematics & Stats Part Time Full Time Computer Science Part Time Mathematics School of Mathematical and Computer Sciences As shown in Chart 11 above, the School of Mathematical and Computer Sciences has a good gender balanced within Actuarial Mathematics and Statistics, along with Mathematics. Computer Science however has a low percentage of female undergraduates. Chart 12 % Male and Female UGs ST&D 08/09 100% 80% 60% 40% 100% 100% 98% 100% Full Time Part Time Full Time Part Time Male Female 20% 0% Combined Studies Textiles & Design School of Textiles and Design The School of Textiles and Design has the most significant gender imbalance of all Schools, with the smallest percentage of male undergraduates as shown above in chart 12.S Staff At the institutional level our gender balance among staff is 54% Male and 46% female. This balance is maintained by females making up 60% of the support staff, were as 32% of our academic staff are female, as shown in chart 13. 8 Chart 13 % Male and Female Staff 2009 100% 80% 60% 40% 68% 54% male female 40% 20% 0% Academic Support All Staff HW 9 3. Disability Profile The University recognises that disclosure levels are low. A higher proportion of our student population discloses disability than our staff population. 7 % of our student population in session 2008-09 (chart 14) declared a disability along side 2% of staff in 2009 (chart 16). Our student population discloses a range of disabilities with dyslexia making up over 40% of declarations in both the 2007-08 and 2008-09 academic sessions, as shown in Chart 15. Students Chart 14 Declared Disabilty 2007-08 and 2008-09 100.0% 80.0% 60.0% No Known Disability Declared Disability 40.0% 20.0% 0.0% 5.7% 7.0% 2007-08 2008-09 Chart 15 Declared Disability 2007-08 and 2008-09 60.0% 40.0% 2007-08 20.0% 2008-09 0.0% s d n d g m re ity lit y te ies lity te in tio em bi bil bi tru ca i li t ar di bl gh l is a i l o c a b n o e t s a s S e o H sa Pr Di Di r/M No on Sp l ly tC of Di rs se l th en ic tia ng d e ar e i u t a r e r r e s p n e a s a o ti H air ar m /P /H lH ng Un Au Le af lc h di ta or ind e l e e n c i 2 e e e B D if h N M ec W Sp s le Dy xia Staff 10 Chart 16 HWU Staff Declared Disability 2009 No known Impairment Disability/Impairment 11 4. Age Profile Our student population is made up mostly of students aged 17-30 years old. Our over 31 age group makes up c12% of the student undergraduate population, as shown in chart 17. Students Chart 17 HWU Student Age Profile 2007 17-30 older than 31 Staff Our staff population has a greater diversity in terms of age ranges. The highest percentage of staff fall into the 44-54 age range (29%), followed by 35-44 (25%). The 25-34 age range makes up 19%of the staff population and 22% are within the range 55-64%. Our smallest percentage of staff come from the 16-24 (3%) and 65 + (1%) age ranges. All of this information is contained in chart 18. Chart 18 HWU Staff Age Ranges 2009 16-24 25-34 35-44 45-54 55-64 65 Plus 12
