Chapter 39: More About Matter Waves 39
advertisement
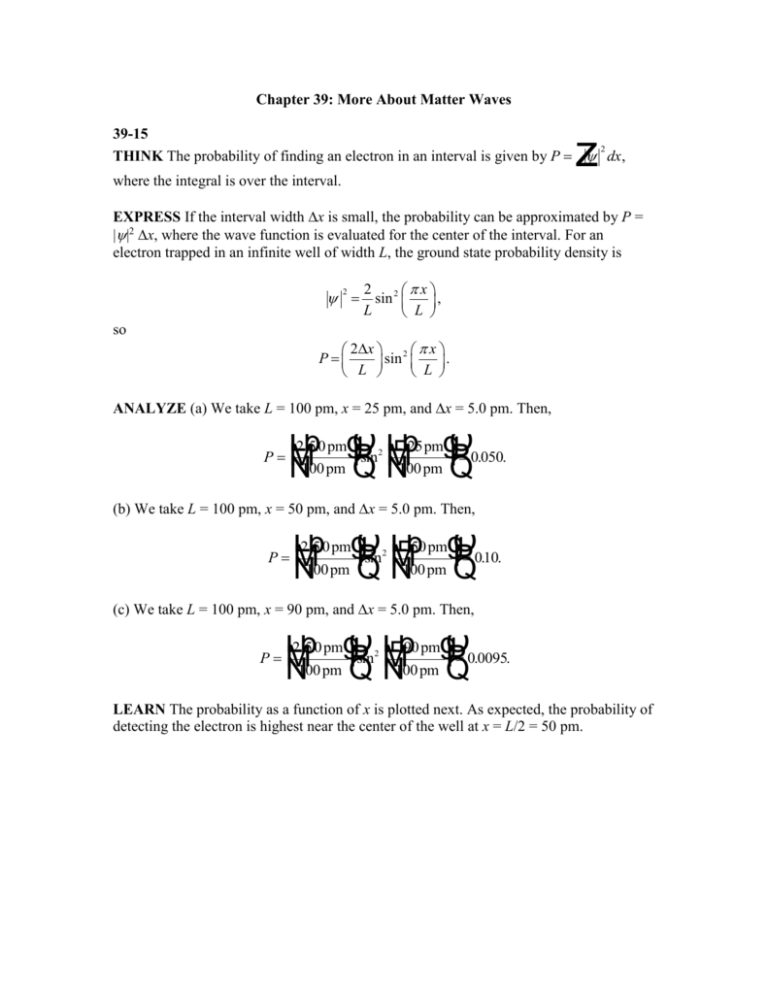
Chapter 39: More About Matter Waves 39-15 2 THINK The probability of finding an electron in an interval is given by P dx, z where the integral is over the interval. EXPRESS If the interval width x is small, the probability can be approximated by P = ||2 x, where the wave function is evaluated for the center of the interval. For an electron trapped in an infinite well of width L, the ground state probability density is 2 2 x sin 2 , L L so 2x 2 x P sin . L L ANALYZE (a) We take L = 100 pm, x = 25 pm, and x = 5.0 pm. Then, P L O Lb25 pmgO 2b 5.0 pmg sin M 0.050. M P N100 pm Q N100 pm P Q 2 (b) We take L = 100 pm, x = 50 pm, and x = 5.0 pm. Then, P L O Lb50 pmgO 2b 5.0 pmg sin M 010 . . M P N100 pm Q N100 pm P Q 2 (c) We take L = 100 pm, x = 90 pm, and x = 5.0 pm. Then, P L O Lb90 pmgO 2b 5.0 pmg sin M 0.0095. M P N100 pm Q N100 pm P Q 2 LEARN The probability as a function of x is plotted next. As expected, the probability of detecting the electron is highest near the center of the well at x = L/2 = 50 pm. 39-27 THINK The energy levels of an electron trapped in a regular corral with widths Lx and Ly are given by Eq. 39-20: 2 h 2 nx2 n y Enx ,ny . 8m L2x L2y EXPRESS With Lx = L and Ly = 2L, we have E n x ,n y L M M N O P P Q L M M N O P P Q 2 n y2 h 2 nx2 n y h2 2 n . x 8m L2x L2y 8mL2 4 Thus, in units of h2/8mL2, the energy levels are given by nx2 ny2 / 4. The lowest five levels are E1,1 = 1.25, E1,2 = 2.00, E1,3 = 3.25, E2,1 = 4.25, and E2,2 = E1,4 = 5.00. It is clear that there are no other possible values for the energy less than 5. The frequency of the light emitted or absorbed when the electron goes from an initial state i to a final state f is f = (Ef – Ei)/h, and in units of h/8mL2 is simply the difference in the values of nx2 ny2 / 4 for the two states. The possible frequencies are as follows: 0.75 1, 2 1,1 , 2.00 1,3 1,1 ,3.00 2,1 1,1 , 3.75 2, 2 1,1 ,1.25 1,3 1, 2 , 2.25 2,1 1, 2 ,3.00 2, 2 1, 2 ,1.00 2,1 1,3 , 1.75 2, 2 1,3 ,0.75 2, 2 2,1 , all in units of h/8mL2. ANALYZE (a) From the above, we see that there are 8 different frequencies. (b) The lowest frequency is, in units of h/8mL2, 0.75 (2, 2 2,1). (c) The second lowest frequency is, in units of h/8mL2, 1.00 (2, 1 1,3). (d) The third lowest frequency is, in units of h/8mL2, 1.25 (1, 3 1,2). (e) The highest frequency is, in units of h/8mL2, 3.75 (2, 2 1,1). (f) The second highest frequency is, in units of h/8mL2, 3.00 (2, 2 1,2) or (2, 1 1,1). (g) The third highest frequency is, in units of h/8mL2, 2.25 (2, 1 1,2). LEARN In general, when the electron makes a transition from (nx, ny) to a higher level ( nx , ny ), the frequency of photon it emits or absorbs is given by 2 2 E Enx ,ny Enx ,ny h 2 ny h 2 ny f nx nx h h 8mL2 4 8mL2 4 h 2 1 n nx2 ny2 n y2 . 2 x 8mL 4 39-53 THINK The ground state of the hydrogen atom corresponds to n = 1, l 0, and ml 0. EXPRESS The proposed wave function is 1 er a 32 a where a is the Bohr radius. Substituting this into the right side of Schrödinger’s equation, our goal is to show that the result is zero. ANALYZE The derivative is d 1 er a 52 dr a so r2 and F IJ G H K 1 d 2 d r r 2 dr dr d r2 er a dr a 5 2 L O M N P Q L O M N P Q 1 2 1 1 2 1 er a . 52 r a a r a a The energy of the ground state is given by E me4 8 20 h2 and the Bohr radius is given by a h 2 0 me 2 , so E e 2 8 a. The potential energy is given by U e 2 4 r , so L O M P N Q 1 2O 1 L1 2O L P . M a rQ Na r P Q a M N L O M N P Q 8 m 8 m e2 e2 8 m e 2 1 2 E U 2 2 2 h h 8 a 4 r h 8 a r me 2 h2 The two terms in Schrödinger’s equation cancel, and the proposed function satisfies that equation. LEARN The radial probability density of the ground state of hydrogen atom is given by Eq. 39-44: 1 4 P(r ) | |2 (4 r 2 ) 3 e 2 r a (4 r 2 ) 3 r 2e 2 r a . a a A plot of P(r) is shown in Fig. 39-20.
