MIAPE_Quant_v1.0_SILAC_MLHS
advertisement
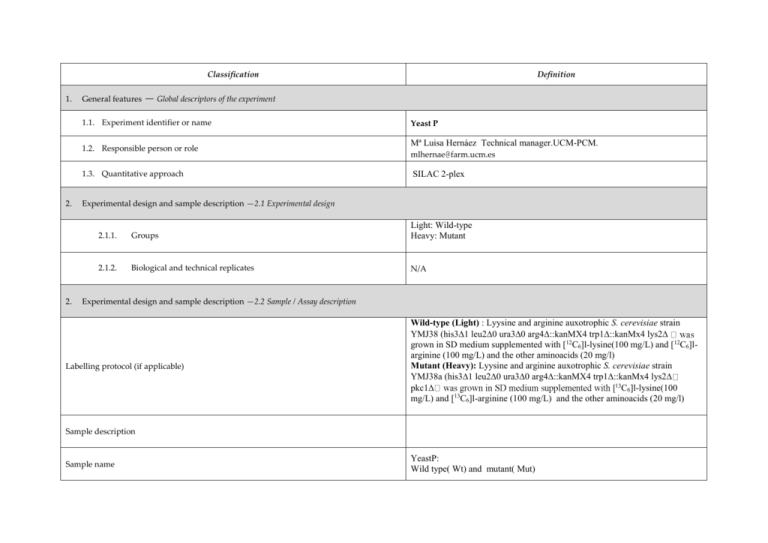
Classification 1. 2. 2. Definition General features — Global descriptors of the experiment 1.1. Experiment identifier or name Yeast P 1.2. Responsible person or role Mª Luisa Hernáez Technical manager.UCM-PCM. mlhernae@farm.ucm.es 1.3. Quantitative approach SILAC 2-plex Experimental design and sample description —2.1 Experimental design 2.1.1. Groups Light: Wild-type Heavy: Mutant 2.1.2. Biological and technical replicates N/A Experimental design and sample description —2.2 Sample / Assay description Labelling protocol (if applicable) Wild-type (Light) : Lyysine and arginine auxotrophic S. cerevisiae strain YMJ38 (his31 leu20 ura30 arg4::kanMX4 trp1::kanMx4 lys2 grown in SD medium supplemented with [12C6]l-lysine(100 mg/L) and [12C6]larginine (100 mg/L) and the other aminoacids (20 mg/l) Mutant (Heavy): Lyysine and arginine auxotrophic S. cerevisiae strain YMJ38a (his31 leu20 ura30 arg4::kanMX4 trp1::kanMx4 lys2 13 pkc1 C6]l-lysine(100 13 mg/L) and [ C6]l-arginine (100 mg/L) and the other aminoacids (20 mg/l) Sample description Sample name YeastP: Wild type( Wt) and mutant( Mut) 2.2.2.2 Sample amount 300 ug of each sample. 600 ug were loaded onto a 12% polyacrilamide gel 2.2.2.3 Sample labelling with assay definition, i.e. MS run / data set together with reporting ion mass, reagent or isotope labelled amino acid Wt : (Light ) Mut: (Heavy) was labelled with 13C6-Lysine and 13C6-Arginine 2.2.2.3 Replicates and/or groups N/A 2.2.3 Isotopic correction coefficients N/A 2.2.4 Internal references N/A 3. Input data — Description and reference of the dataset used for quantitative analysis: type, format and availability of the data. No actual values are requested here. 3.1. Input data type 3.2. Input data format 4. Full MS scan Raw Thermo files (*.RAW) 3.3. Input data merging Sample was fractionated in a 12% polyacrilamide gel. 15 slices were excised and trypsin digested. Raw data were combined and analysed using Thermo Proteome Discoverer 1.2 3.4. Availability of the input data Provide a Pride repository. Protocol —Description of the software and methods applied in the quantitative analysis (including transformation functions, aggregation functions and statistical calculations). 4.1. Quantification software name, version and manufacturer Thermo Proteome Discoverer 1.2 4.2. Description of the selection and/or matching method of features, together with the Precursor ion quantification: peptide abundance is determined from the relative MS signal intensities of multiple isotopically labeled peptides and unlabeled peptides. Peptide Ratio:Heavy/Light. description of the method of the primary extracted quantification values determination for each feature and/or peptide Mass Precision: 4 ppm S/N Threshold: 1 RT Tolerance of Isotope Pattern Multiplets [min]: 0.2 Single-Peak/Missing Channels Allowed: 0 4.3. Confidence filter of features or peptides prior to quantification Peptide Confidence-Value: High Confidence Protein Mascot score > 22 4.4. Description of data calculation and transformation methods 4.4.1. 4.4.2. Missing values imputation and outliers removal Quantification values calculation and / or ratio determination from the primary extracted quantification values Reject All Quan Values If Not All Quan Channels Are Present. Quantification was taken from the spectrum with the highest ID score Use Only Unique Peptides Peptide Ratio:Heavy/Light as a log2-fold change 4.4.3. Replicate aggregation N/A 4.4.4. Normalization Normalization was done performing the median of all the ratios obtained at peptide level. 4.4.5. Protein quantification values calculation and / or ratio determination from the peptide quantification values 4.4.6. Protocol specific corrections 4.5. Description of methods for (statistical) estimation of correctness 4.6. Calibration curves of standards Protein ratios are calculated as the median of all quantified peptide hits belonging to a protein. N/A Heavy/Light Variability (the variability of the peptide ratios that are used to calculate a particular protein ratio. They are similar to a coefficient of variation.) Heavy/Light Variability <25 and Heavy/Light Count(the number of peptide ratios that were used to calculate a particular protein ratio) >2 N/A 5. Resulting data —Provide the actual quantification values resulting from your quantification software together with their estimated confidence. Depending of the quantification technique or even of the quantification software, only some of the following items could be satisfied (e.g., for spectral counting, only quantification values at protein level can be provided) 5.1 Quantification values at peptide and/or feature level: Actual quantification values achieved for each peptide and/or, in case of feature-based quantification, for the corresponding features (mapped back from each peptide), together with their estimated confidence. 5.1.1 Primary extracted quantification values for each feature (e.g. area, height, etc.), with their statistical estimation of correctness 5.1.2 Quantification values for each peptide as a result of the aggregation of the values of the previous section (5.1.1), with their statistical estimation of correctness http://proteo.cnb.csic.es/downloads/miape-quant/5.1.2.SILAC_MLHS.xls 5.2 Quantification values at protein level: Actual quantification values achieved for each protein and for each protein ambiguity group, together with the confidence in the quantification value. Basic / raw quantification values with statistical estimation of correctness 5.2.2 Transformed / aggregated / combined quantification values of the proteins at group level, with their statistical estimation of correctness http://proteo.cnb.csic.es/downloads/miape-quant/5.2.2.SILAC_MLHS.xls
