Motion Detector Activity
advertisement
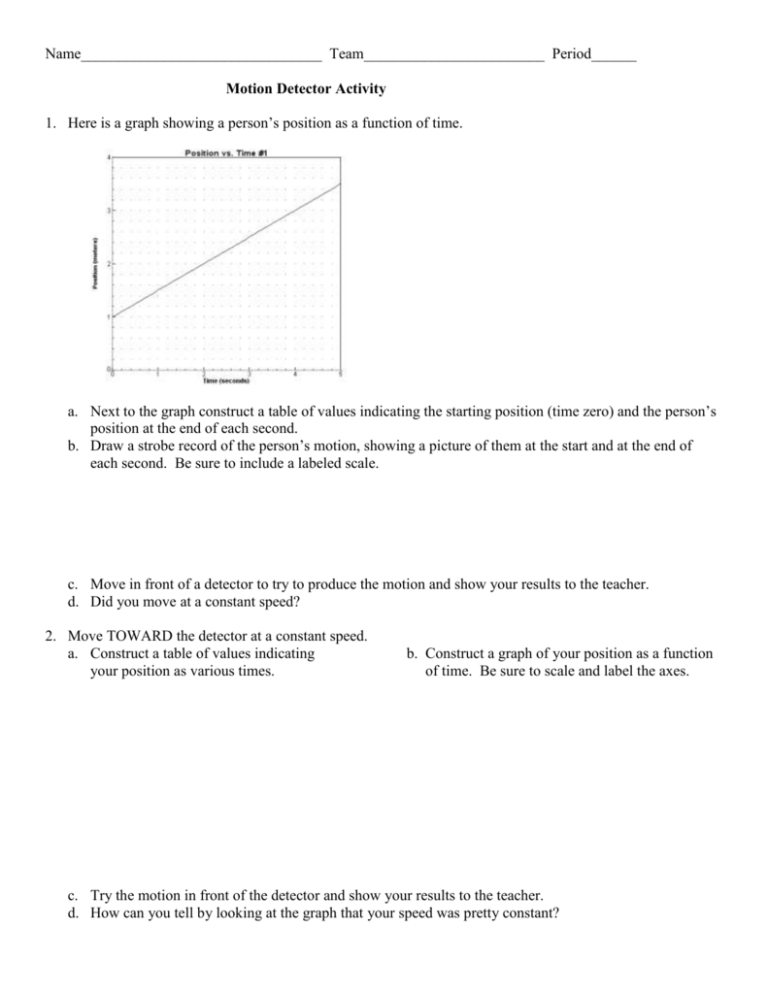
Name________________________________ Team________________________ Period______ Motion Detector Activity 1. Here is a graph showing a person’s position as a function of time. a. Next to the graph construct a table of values indicating the starting position (time zero) and the person’s position at the end of each second. b. Draw a strobe record of the person’s motion, showing a picture of them at the start and at the end of each second. Be sure to include a labeled scale. c. Move in front of a detector to try to produce the motion and show your results to the teacher. d. Did you move at a constant speed? 2. Move TOWARD the detector at a constant speed. a. Construct a table of values indicating your position as various times. b. Construct a graph of your position as a function of time. Be sure to scale and label the axes. c. Try the motion in front of the detector and show your results to the teacher. d. How can you tell by looking at the graph that your speed was pretty constant? 3. Move in front of detector to produce a graph that looks like this. a. Show your results to the teacher. b. Draw a strobe record for your motion showing a picture of yourself at the start and at the end of each second. Be sure to include a labeled scale. c. How can you tell by looking at the strobe record when you were traveling the fastest? d. How can you tell by looking at the strobe record when you were traveling the slowest? e. What was your average speed for the entire five seconds? Show how you came up with your answer. CHALLENGE: Write an equation for your position as a function of time from Problem #1. Show that your equation works. SUPER CHALLENGE: Write an equation for your position as a function of time from Problem #3. Show that your equation works.


