1. The claim is that the proportion of women who use Internet
advertisement
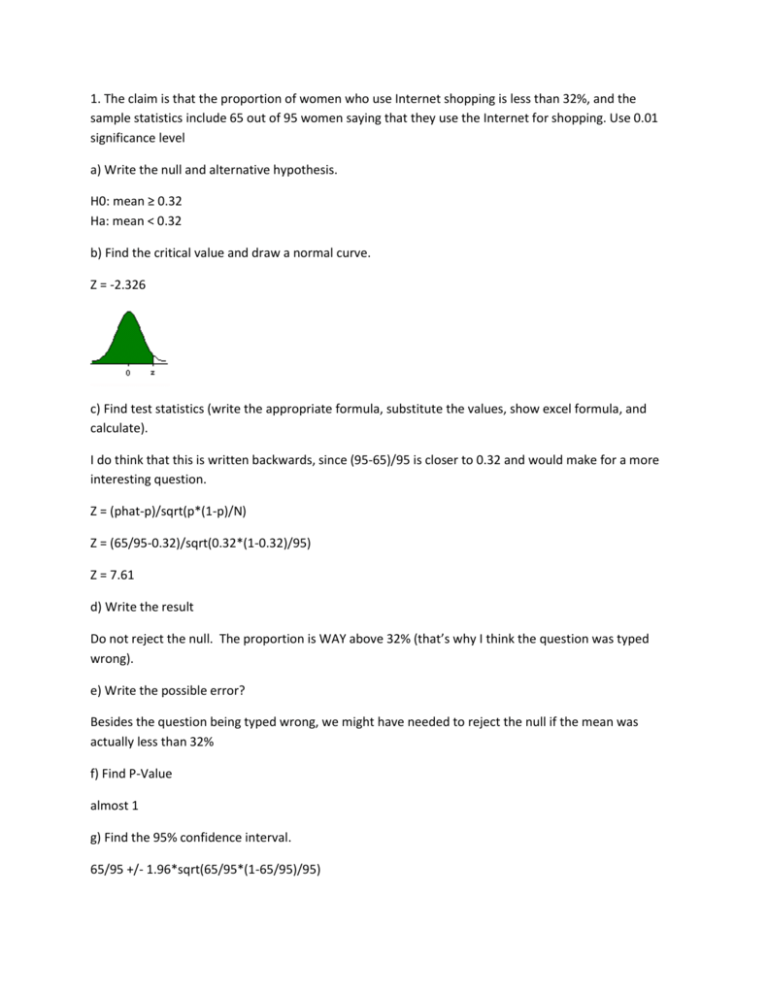
1. The claim is that the proportion of women who use Internet shopping is less than 32%, and the sample statistics include 65 out of 95 women saying that they use the Internet for shopping. Use 0.01 significance level a) Write the null and alternative hypothesis. H0: mean ≥ 0.32 Ha: mean < 0.32 b) Find the critical value and draw a normal curve. Z = -2.326 c) Find test statistics (write the appropriate formula, substitute the values, show excel formula, and calculate). I do think that this is written backwards, since (95-65)/95 is closer to 0.32 and would make for a more interesting question. Z = (phat-p)/sqrt(p*(1-p)/N) Z = (65/95-0.32)/sqrt(0.32*(1-0.32)/95) Z = 7.61 d) Write the result Do not reject the null. The proportion is WAY above 32% (that’s why I think the question was typed wrong). e) Write the possible error? Besides the question being typed wrong, we might have needed to reject the null if the mean was actually less than 32% f) Find P-Value almost 1 g) Find the 95% confidence interval. 65/95 +/- 1.96*sqrt(65/95*(1-65/95)/95) 0.59 to 0.78 2. Test the claim that the mean Cotinine level of all smokers is different than 200 at 0.05 significance level. A sample of 28 smokers has a mean Cotinine level 199. Assume that the population standard deviation is 9.2. a) Write the null and alternative hypothesis. H0: mean = 200 Ha: mean not equal to 200 b) Find the critical value and draw a normal curve. +/- 1.96 c) Find test statistics (write the appropriate formula, substitute the values, show excel formula, and calculate). (x-mu)/(sd/sqrt(N)) (199-200)/(9.2/sqrt(28)) -0.58 d) Write the result Do not reject the null hypothesis. The mean is not different from 200. e) Write the possible error? The error would be if the mean was actually different from 200. f) Find P-value 0.57 g) Find the 95% confidence interval. 199 +/- 1.96*9.2/sqrt(28) 195.59 to 202.41 3. The claim is that the mean IQ scores of professors is more than 118 at 0.05 significance level. A sample of 25 professors has mean IQ score of 121 and their standard deviation 12. a) Write the null and alternative hypothesis. H0: mean ≤ 118 Ha: mean > 118 b) Find the critical value and draw a normal curve. Df = n-1 = 24 Tcrit = 1.711 c) Find test statistics (write the appropriate formula, substitute the values, show excel formula, and calculate. T = (x-mu)/(s/sqrt(N)) = (121-118)/(12/sqrt(25)) = 1.25 d) Write the result Do not reject the null hypothesis. The mean is not greater than 118. e) Write the possible error? We have made an error if the mean is actually greater than 118. f) Find P-value 0.11 g) Find the 95% confidence interval. 121 +/- 2.064*12/sqrt(25) 116.05 to 125.95 4. Assume that we want to estimate the mean IQ score for all the statistics students. How many statistics students must be randomly selected for IQ tests if we want 95% confidence that the sample mean is within 3 IQ points of the population mean? Use σ = 5 N = (z*sd/E)^2 N = (1.96*5/3)^2 N = 10.6711111 Rounds up to: N = 11 5. As the newly hired manager of a company, you want to determine the percentage of adults in your state who has cell phones without landline. How many adults must you survey to be 95% confident that the sample percent is within 4 percentage points? Assume p = 0.5: N = p(1-p)(z/E)^2 N = 0.5*0.5*(1.96/0.04)^2 N = 600.25 Rounds up to: N = 601 Estimating a Population Proportion (Excel) 6. Gender Selection: The Genetics and IVF Institute conducted a clinical trial of the XSORT method designed to increase the probability of conceiving a girl. As of this writing, 574 babies were born to parents using the XSORT method, and 525 of them were girls. a) What is the best point estimate of the population proportion of girls born to parents using the XSORT method? 525/574 = 0.91 b) Use the sample data to construct a 95% confidence interval estimate of the percentage of girls born to parents using the XSORT method. p +/- 1.96*sqrt(p*(1-p)/N) 525/574 +/- 1.96*sqrt(525/574*(1-525/574)/574) 0.89 to 0.94 c) Based on the results, does the XSORT method appear to be effective? Why or why not? Yes, the entire confidence interval is well above the 50/50 chance you would expect naturally. 7. Postponing Death: An interesting and popular hypothesis is that individuals can temporarily postpone their death to survive a major holiday or important event such as a birthday. In a study of this phenomenon, it was found that in the week before and the week after Thanksgiving (based on data from “Holidays, Birthdays, and Postponement of Cancer Death,” by Young and Hade, Journal of the American Medical Association, Vol. 292, No. 24.) a) What is the point estimate of the proportion of deaths in the week before Thanksgiving to the total deaths in the week before and the week after Thanksgiving? There was no data posted. b) Construct a 95% confidence interval estimate of the proportion of deaths in the week before Thanksgiving to the total deaths in the week before and the week after Thanksgiving. There was no data posted. c) Based on the result, does there appear to be any indication that people can temporarily postpone their death to survive the Thanksgiving holiday? Why or why not? There was no data posted. 8. Mendelian Genetics: When Mendel conducted his famous genetics experiments with peas, one sample of offspring consisted of 428 green peas and 152 yellow peas. a) Find a 95% confidence interval estimate of the percentage of yellow peas. p +/- 1.96*sqrt(p*(1-p)/N) 152/428 +/- 1.96*sqrt(152/428*(1-152/428)/428) 0.31 to 0.40 b) Based on his theory of genetics, Mendel expected that 25% of the offspring peas would be yellow. Given that the percentage of offspring yellow peas is not 25%, do the results contradict Mendel’s theory? Why or why not? The 95% confidence interval does not include 0.25, so this single experiment does appear to contradict Mendel’s theory. We can probably assume there is some other factor at play, besides the pure genetics. Estimates and Sample Sizes: 9. Cell Phones and Cancer: A study of 420,095 Danish cell phone users found that 135 of them developed cancer of the brain or nervous system. Prior to this study of cell phone use, the rate of such cancer was found to be 0.0340% for those not using cell phones. The data are from the journal of the National Cancer Institute. a) Use the sample data to construct a 95% confidence interval estimate of the percentage of cell phone users who develop cancer of the brain or nervous system. p +/- 1.96*sqrt(p*(1-p)/N) 135/420095 +/- 1.96*sqrt(135/420095*(1-135/420095)/420095) 0.0267% to 0.0376% b) Do cell phone users appear to have a rate of cancer of the brain or nervous system that is different from the rate of such cancer among those not using cell phones? Why or why not? No, it doesn’t appear that cell phone users have a different cancer rate. The 95% confidence interval based on the sample includes the percentage from the survey taken prior to cell phone use. 10. Braking Distances: How many car must be randomly selected and tested in order to estimate the mean braking distance of registered cars in the United States? We want 99% confidence that the sample mean is within 2ft of the population mean, and the population standard deviation is known to be 7 ft. N = (z*sd/E)^2 N = (2.5758*7/2)^2 N = 81.2756 Rounds up to: N = 82 Estimating a Population Mean: σ Known 11. Perception of Time: Randomly selected statistics students of the author participated in an experiment to test their ability to determine when 1 min (or 60 seconds) has passed. Forty students yielded a sample mean of 58.3 sec. Assume that σ = 9.5 sec. a) Find the best point estimate of the mean time for all statistics students. The sample mean: 58.3 sec b) Construct a 95% confidence interval estimate of the population mean of all statistics students. Mean +/- z*sd/sqrt(N) 58.3 +/- 1.96*9.5/sqrt(40) 55.36 to 61.24 c) Based on the results, is it likely that their estimates have a mean that is reasonably close to 60 sec? Yes, it is likely, since the 95% confidence interval includes 60 seconds in its range. Applications of Normal Distributions. IQ Scores. Assume that adults have IQ scores that are normally distributed with a mean of 100 and a standard deviation of 15 (as on the Wechsler test). (Hint: Draw a graph in each case). 12. Find the probability that a randomly selected adult has an IQ that is less than 115. Normal Probability Distribution (Excel) =NORMDIST(115,100,15,1) = 0.84 13. Tall Clubs International is a social organization for tall people. It has a requirement that men must be at least 74 in. tall, and women must be at least 70 in. tall. a) What percentage of men meet that requirement? You are missing data on the mean/stdev heights of men and women, which should have been provided. b) What percentage of women meet that requirement? You are missing data on the mean/stdev heights of men and women, which should have been provided. c) Are the height requirements for men and women fair? Why or why not? You are missing data on the mean/stdev heights of men and women, which should have been provided. Let me know if you have any questions, and if you're set, thanks for accepting. Positive feedback is appreciated :) -Scott

