1 - JustAnswer
advertisement
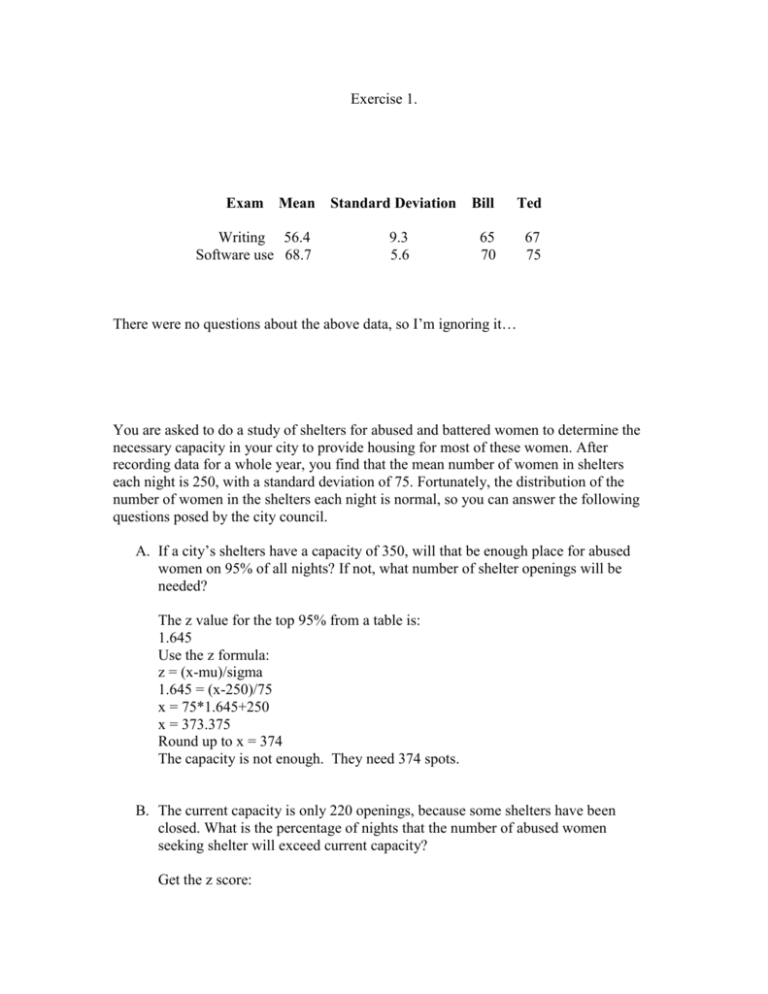
Exercise 1. Exam Mean Writing 56.4 Software use 68.7 Standard Deviation 9.3 5.6 Bill Ted 65 70 67 75 There were no questions about the above data, so I’m ignoring it… You are asked to do a study of shelters for abused and battered women to determine the necessary capacity in your city to provide housing for most of these women. After recording data for a whole year, you find that the mean number of women in shelters each night is 250, with a standard deviation of 75. Fortunately, the distribution of the number of women in the shelters each night is normal, so you can answer the following questions posed by the city council. A. If a city’s shelters have a capacity of 350, will that be enough place for abused women on 95% of all nights? If not, what number of shelter openings will be needed? The z value for the top 95% from a table is: 1.645 Use the z formula: z = (x-mu)/sigma 1.645 = (x-250)/75 x = 75*1.645+250 x = 373.375 Round up to x = 374 The capacity is not enough. They need 374 spots. B. The current capacity is only 220 openings, because some shelters have been closed. What is the percentage of nights that the number of abused women seeking shelter will exceed current capacity? Get the z score: z = (x-mu)/sigma z = (220-250)/75 z = -0.4 prob(z > -0.4) from a table is: 0.6554 = 65.54% of nights Second assignment 10. For the total population of a large southern city, mean family income is $34,000, with a standard deviation (for the population) of $5,000. A. Imagine that you are taking a subsample of 200 city residents. What is the probability that your sample mean is between $33,000 and $34,000? z(33000) = (33000-34000)/(5000/sqrt(200)) z = -2.8284 z(34000) = 0, since it’s the mean prob(-2.8284 < z < 0) from a table is: 0.4977 B. For this same sample size, what is the probability that the same mean exceeds $37,000? z(37000) = (37000-34000)/(5000/sqrt(200)) Z = 8.4853 prob(z > 8.4853) = 0 (it’s just slightly above 0, but any table shows 0) Third assignment PRESTG80 Occupational Prestige Score Statistic High School Diploma Bachelor’s Degree Mean Median Std. Deviation Minimum Range Interquartile Range Mean Median Std. Deviation Minimum Maximum Range Interquartile Range 40.50 40.00 11.142 17 74 74 52.74 51.00 12.675 17 86 69 20 A. Construct the 90% confidence interval for occupational prestige for respondents with only a high school diploma (N=2,153). The z value for 90% confidence is 1.645. The interval goes from: mean-z*sd/sqrt(N) to mean+z*sd/sqrt(N) 40.5-1.645*11.142/sqrt(2153) to 40.5+1.645*11.142/sqrt(2153) 40.10 to 40.90 B. Construct the 90% confidence interval for occupational prestige for respondents with a bachelor’s degree (N=750). State in words the meaning of the result. The z value for 90% confidence is 1.645. The interval goes from: mean-z*sd/sqrt(N) to mean+z*sd/sqrt(N) 52.74-1.645*12.675/sqrt(750) to 52.74+1.645*12.675/sqrt(750) 51.98 to 53.50 We can be 90% confident that the true mean prestige value for these people lies between these values. C. Use these statistics to discuss differences in occupation prestige scores by educational attainment. The entire confidence interval for bachelor’s degrees is higher than the interval for just high school diplomas. Therefore, we can be very confident that there is indeed a higher prestige for people with a degree. Fourth assignment 1. A subsample of the 2006 MTF survey suggests that adolescents are generally concerned with social issues. In fact, 70% of the 1,482 respondents who answered the question reported that they either sometimes or often think about social issues. Estimate at the 95% and 99% confidence levels the proportion of all adolescents who sometimes or often think about social issues. 95% The z value is 1.96. The interval goes from: p-z*sqrt(p*(1-p)/N) to p+z*sqrt(p*(1-p)/N) 0.7-1.96*sqrt(0.7*0.3/1482) to 0.7+1.96*sqrt(0.7*0.3/1482) 0.677 to 0.723 99% The z value is 2.5758. The interval goes from: p-z*sqrt(p*(1-p)/N) to p+z*sqrt(p*(1-p)/N) 0.7-2.5758*sqrt(0.7*0.3/1482) to 0.7+2.5758*sqrt(0.7*0.3/1482) 0.669 to 0.731

